Results for other experiment kinds
In short
- Every experiment page has the same six tabs as a classification run. What fills them depends on the kind of problem.
- Each result is compared with a floor that a trivial method reaches: a naive forecast, popularity, or chance co-occurrence. Read that comparison first.
- Recorded qualifications and notes say how to read a result. They are part of the result, not decoration.
- Recommendation and ranking rules are tested on held-out customers or occasions, so each rule has Train and Test numbers.
This page covers forecasting, anomaly detection, clustering, recommendation, ranking and association rules, each with a real run from the sample datasets. For classification and regression, and for the tabs that work the same way for every kind, see Results and evidence.
| Kind | Headline to read first | Compared with |
|---|---|---|
| Forecast | Held-out MASE | A naive forecast |
| Anomaly detection | Rows flagged at the threshold | A label, when you have one |
| Clustering | Number of groups and silhouette | The auto-k sweep |
| Recommendation | Hit@K on held-out customers | Popularity |
| Ranking | NDCG@K on held-out occasions | Popularity |
| Association rules | Rules that hold up on withheld baskets | Independence of items |
Forecast
Example: a 14-day daily price forecast, statistical backend, one series.
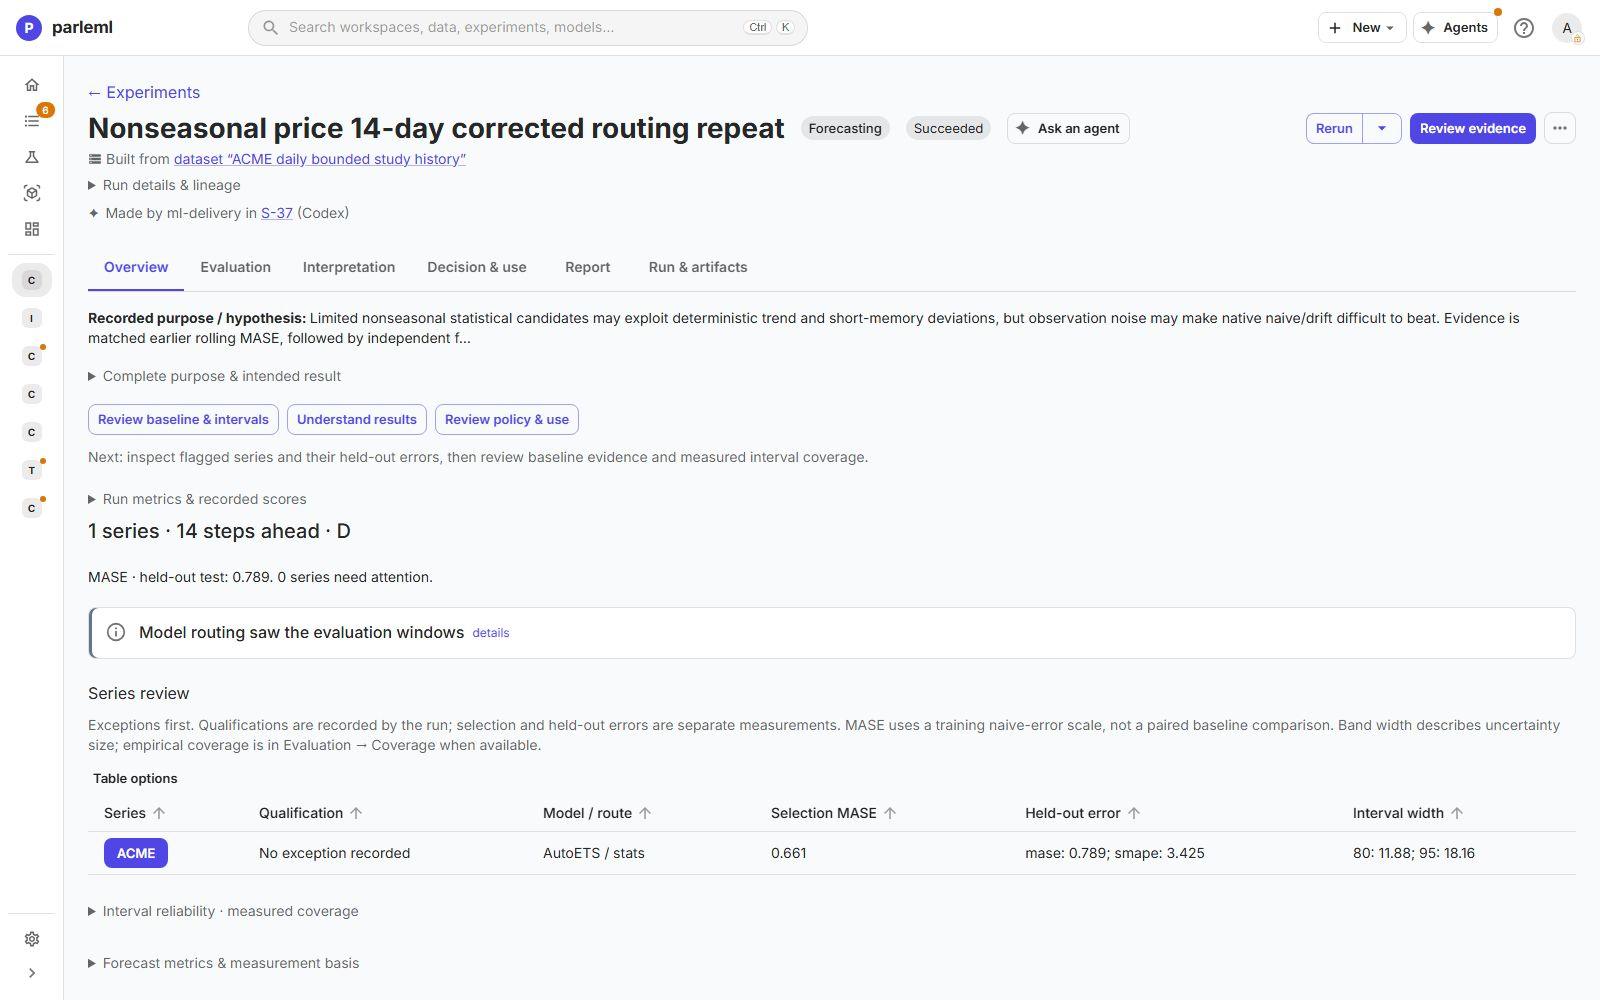
Overview gives the shape (1 series, 14 steps ahead, daily) and the held-out score. Here MASE is 0.789: 21% less error than a naive forecast. Below 1 beats naive; above 1 loses to it. The series review lists the series that need attention first, with their qualification, selected model, selection and held-out MASE, and interval width.
Evaluation → Performance has these views:
| View | Shows |
|---|---|
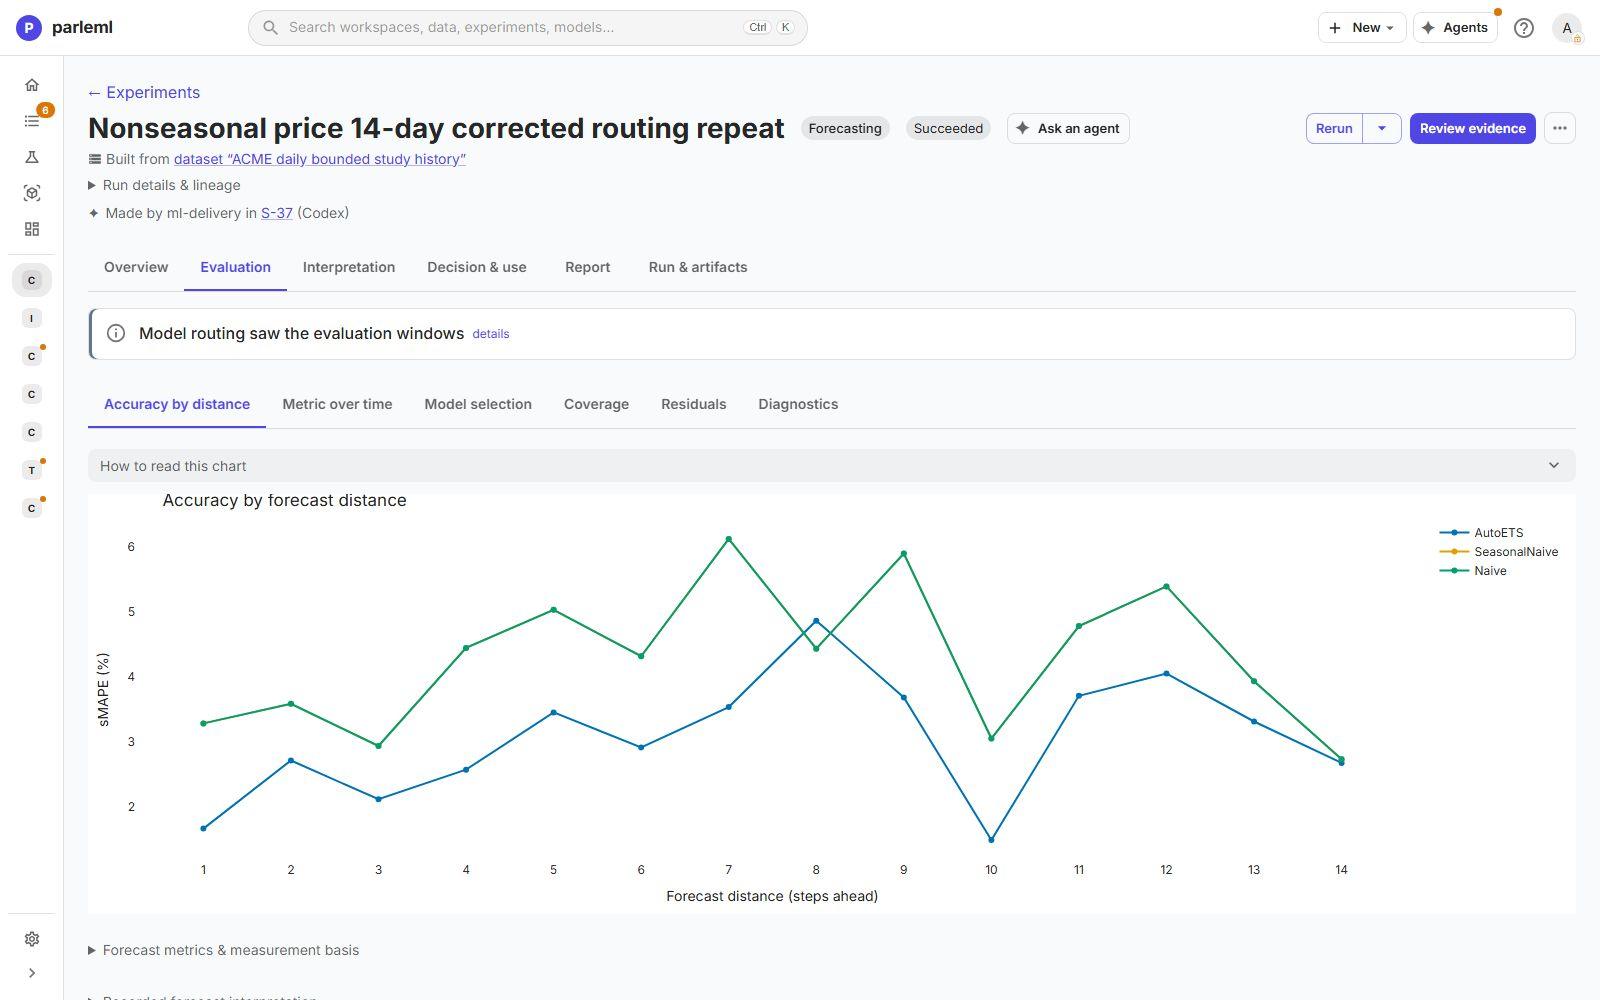
| Accuracy by distance | Error at each step ahead, for the winner and the baselines. Error normally grows with distance. A flat line can mean the model is not using recent history. |
| Metric over time | The error through training and holdout, so a recent change in behaviour stands out. |
| Group metrics | The error for each group of series, when the run has groups. |
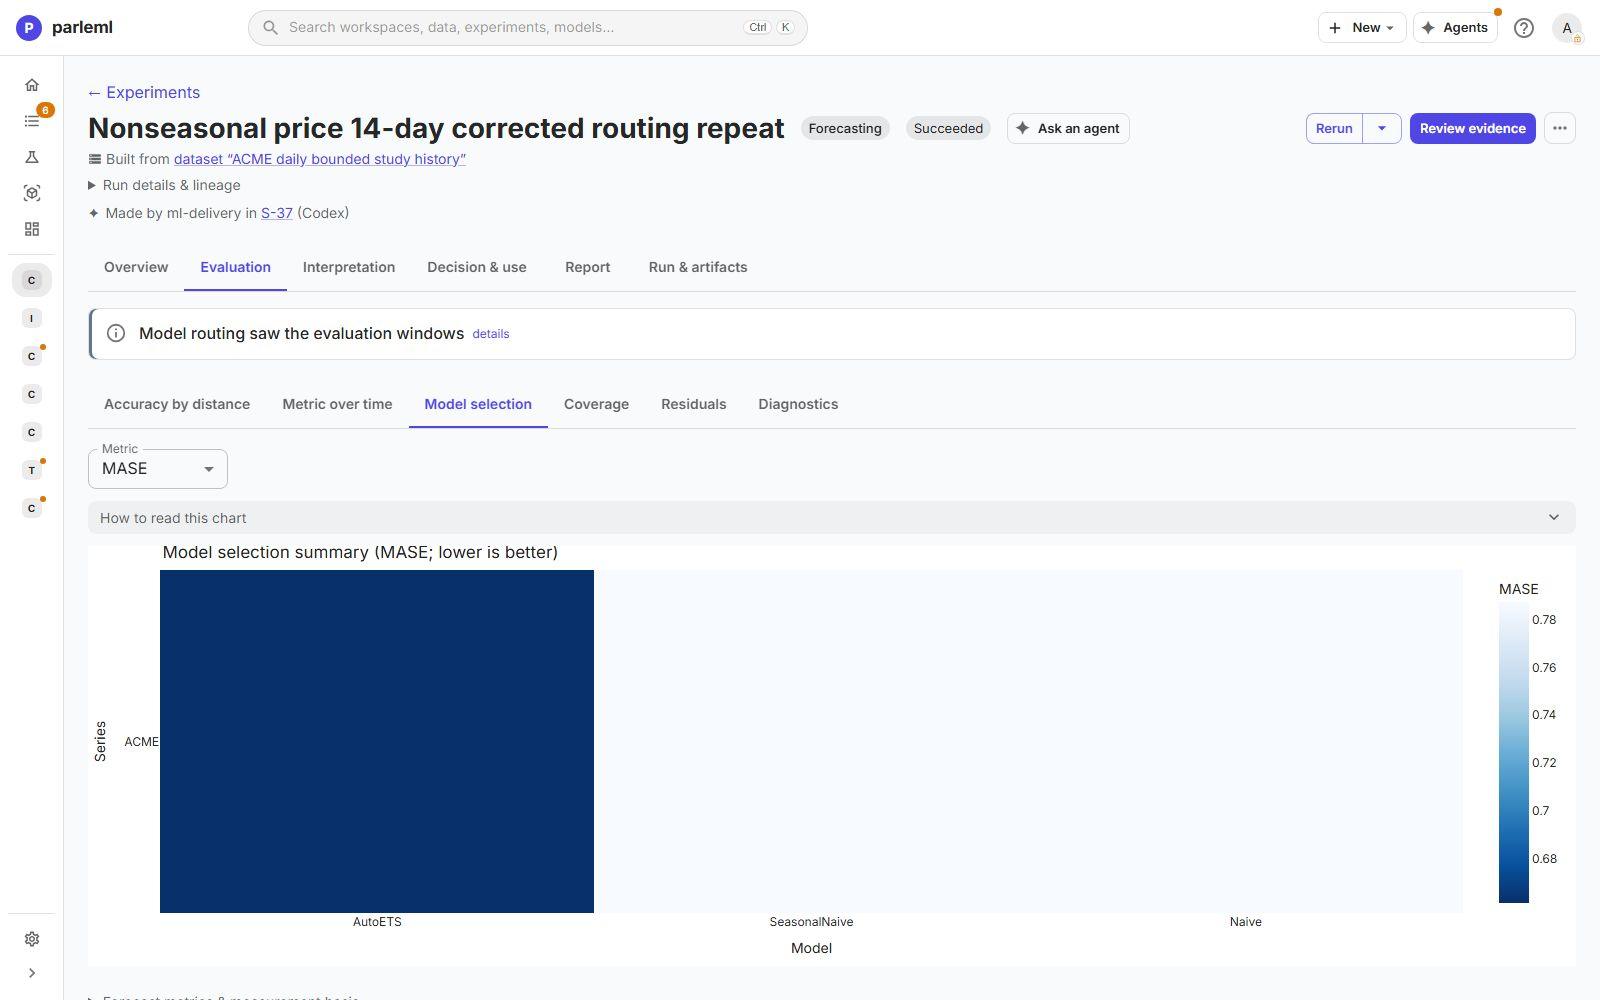
| Model selection | Each candidate's score on each series. The winner per series is the one that did best. |
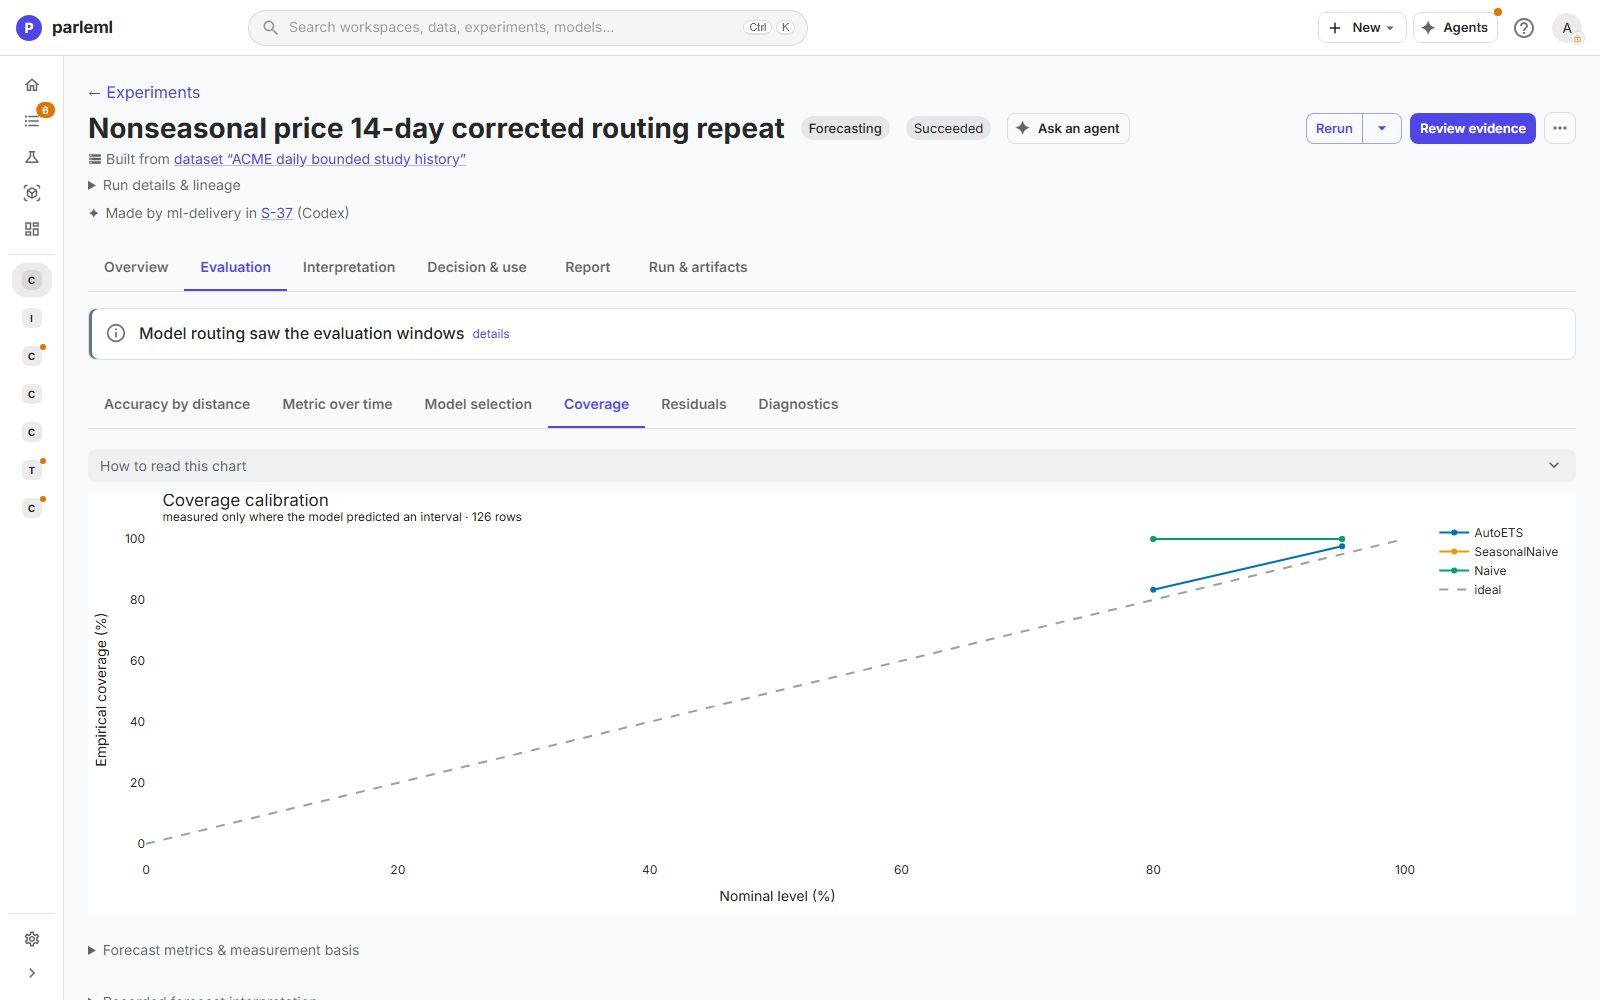
| Coverage | Whether the prediction intervals contain the truth as often as they claim, at each level. |
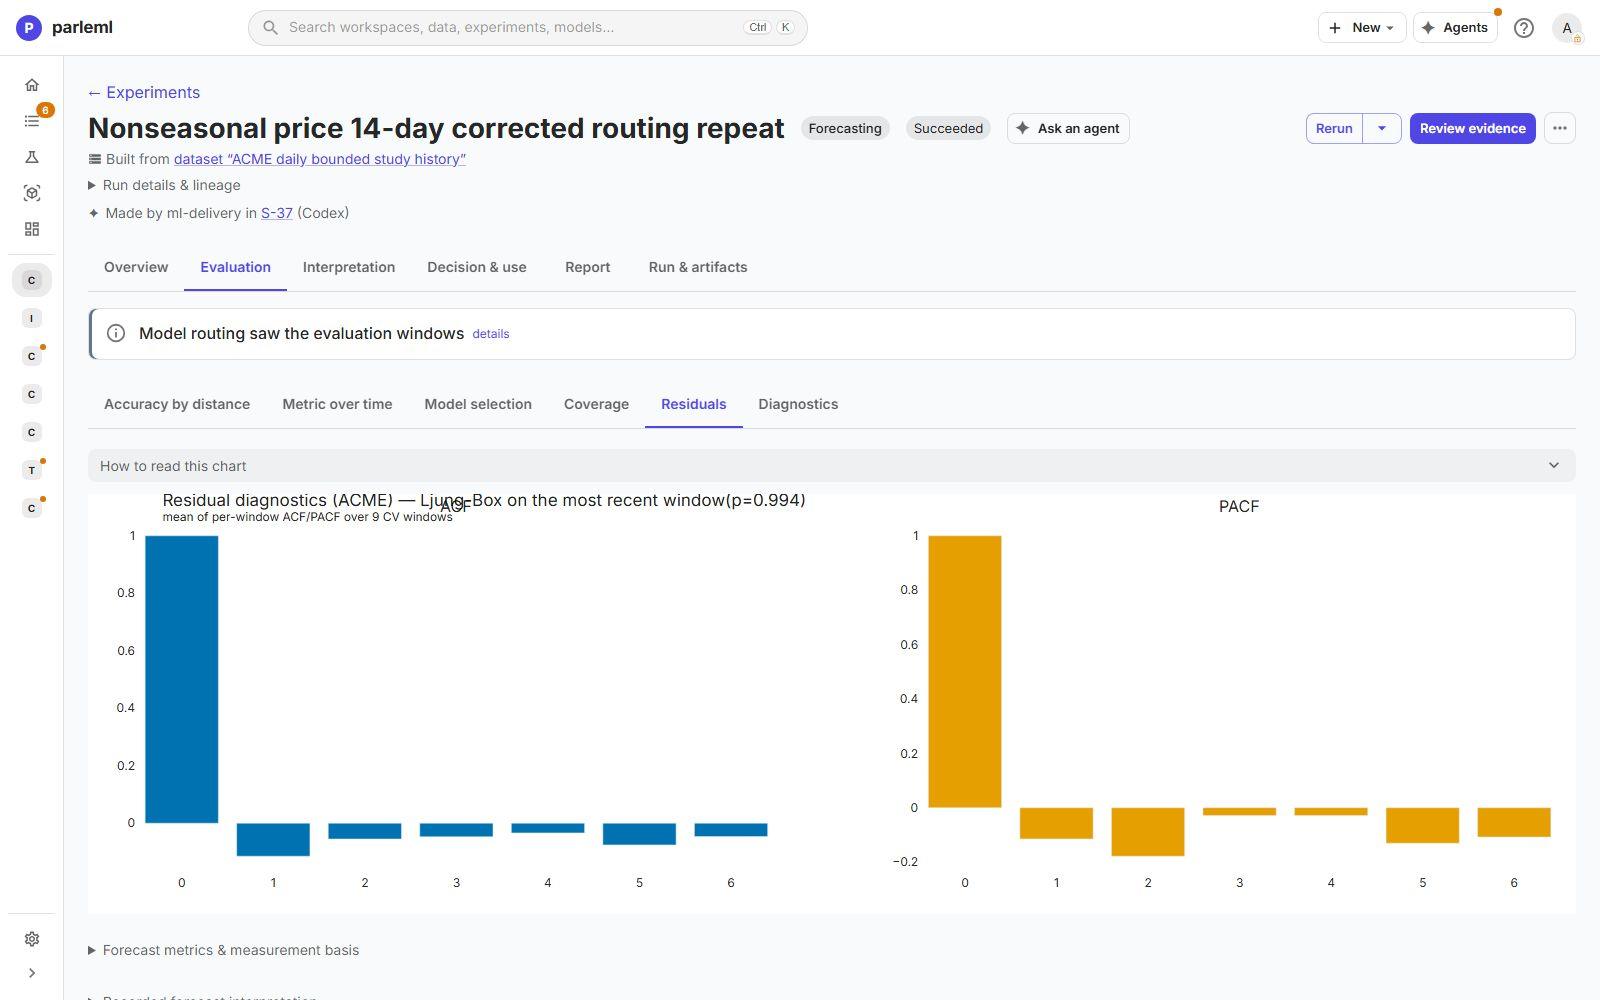
| Residuals | Autocorrelation of the errors, with a Ljung-Box test. Pattern left in the errors is signal the model missed. |
| Diagnostics | Seasonal profiles, autocorrelation by lag, and the preprocessing summary (frequency, gaps filled, series dropped). |
Interpretation → Forecast & model shows the Forecast with its intervals and Actual vs predicted for every backtest window. Other views appear when they apply:
- Shapley and Feature importance, by horizon and series, for a tree backend. A statistical model has no features to attribute, so these do not appear;
- Hierarchy, when the series roll up into groups;
- Model, the ensemble members and weights of the AutoGluon backend.
A tree backend also gets the full Explain catalogue.
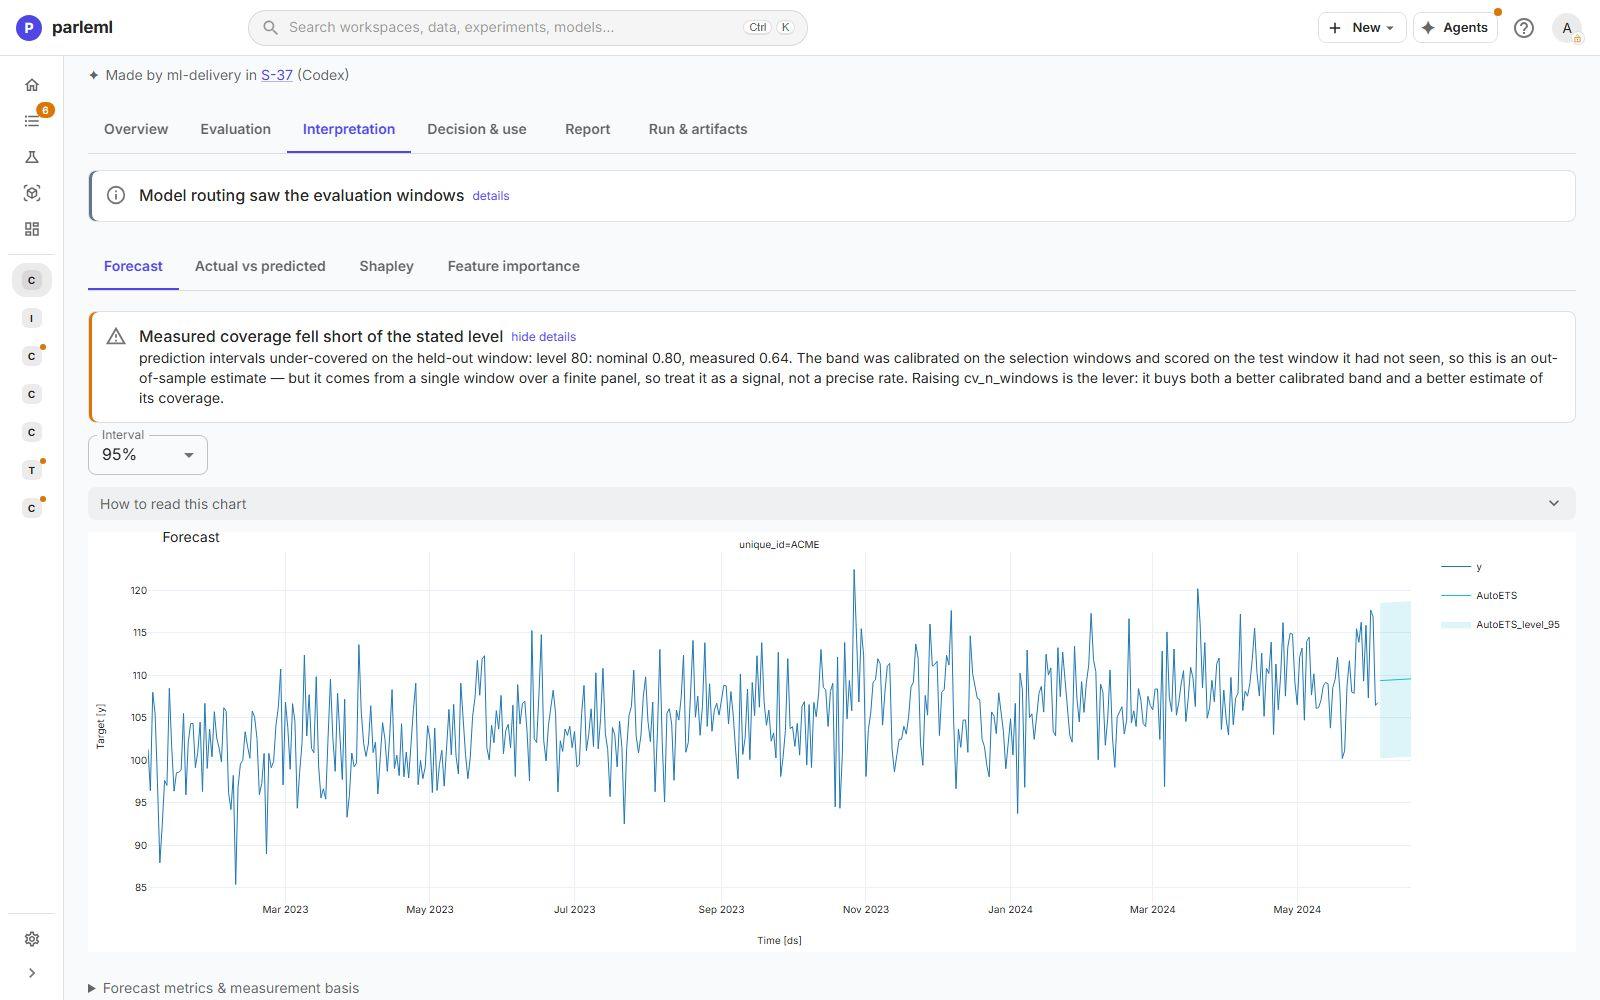
Read the notes. Here ParleML flags that the 80% interval covered only 64% of held-out points. It explains that the estimate comes from a single window, and names the fix: more backtest windows.
Decision & use holds the release records.
Anomaly detection
Example: a review of resolved support tickets, with text, tags and numbers, using Isolation Forest.
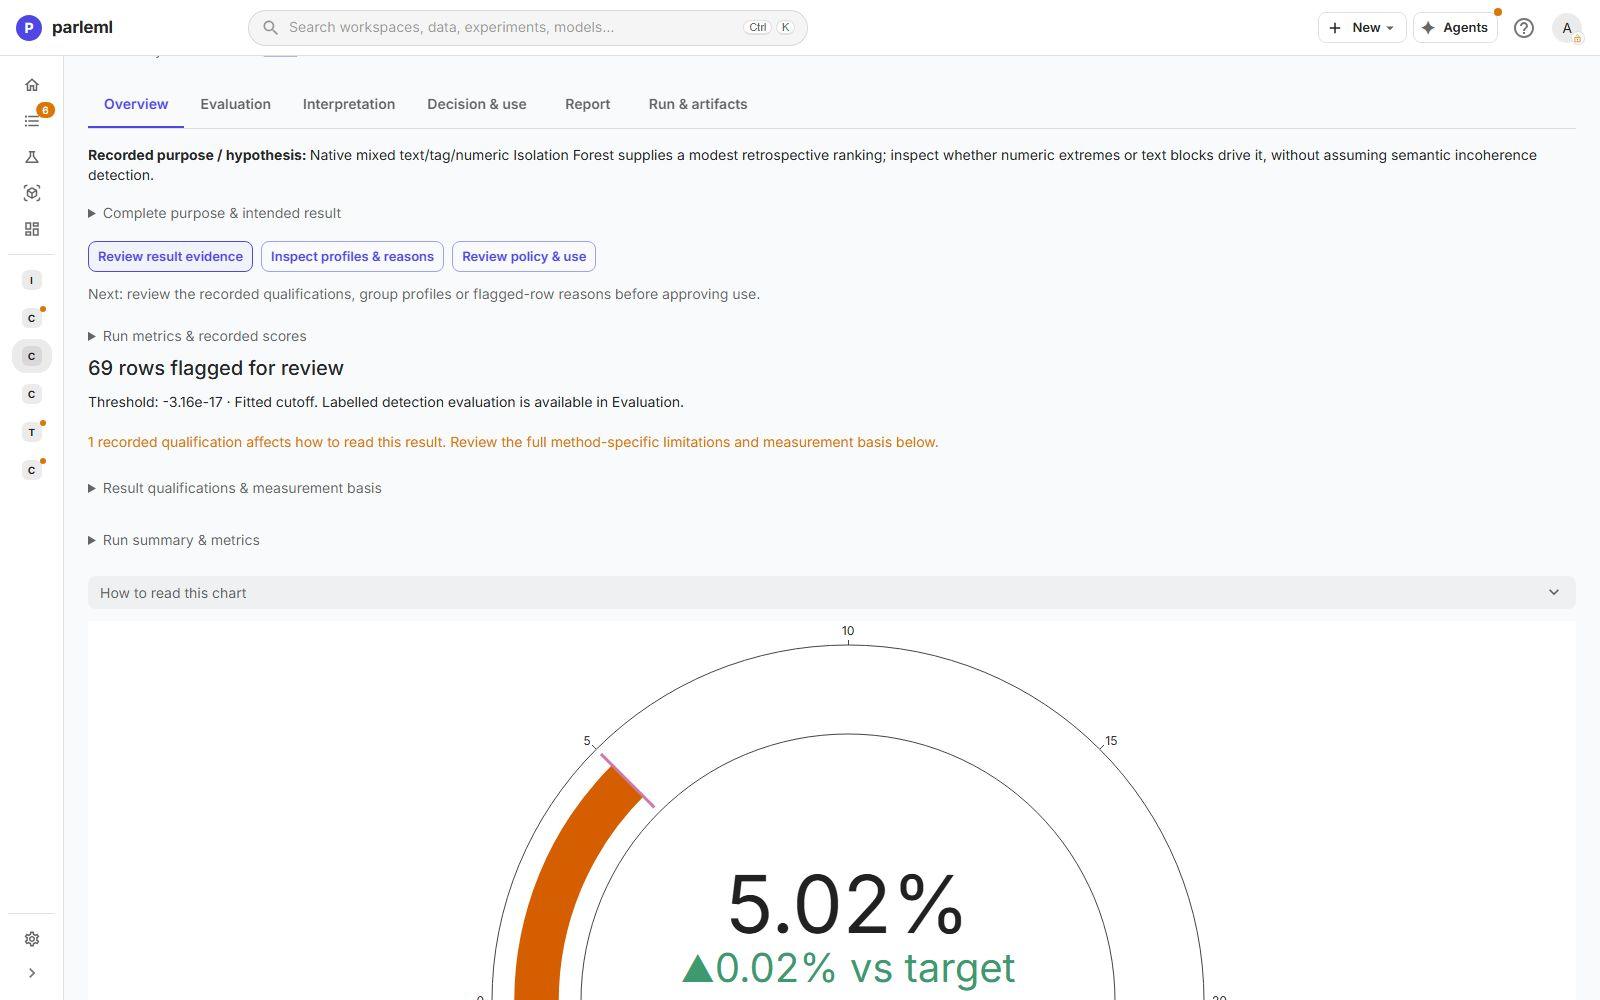
Overview: 69 rows flagged for review (5.02%), at a fitted threshold.
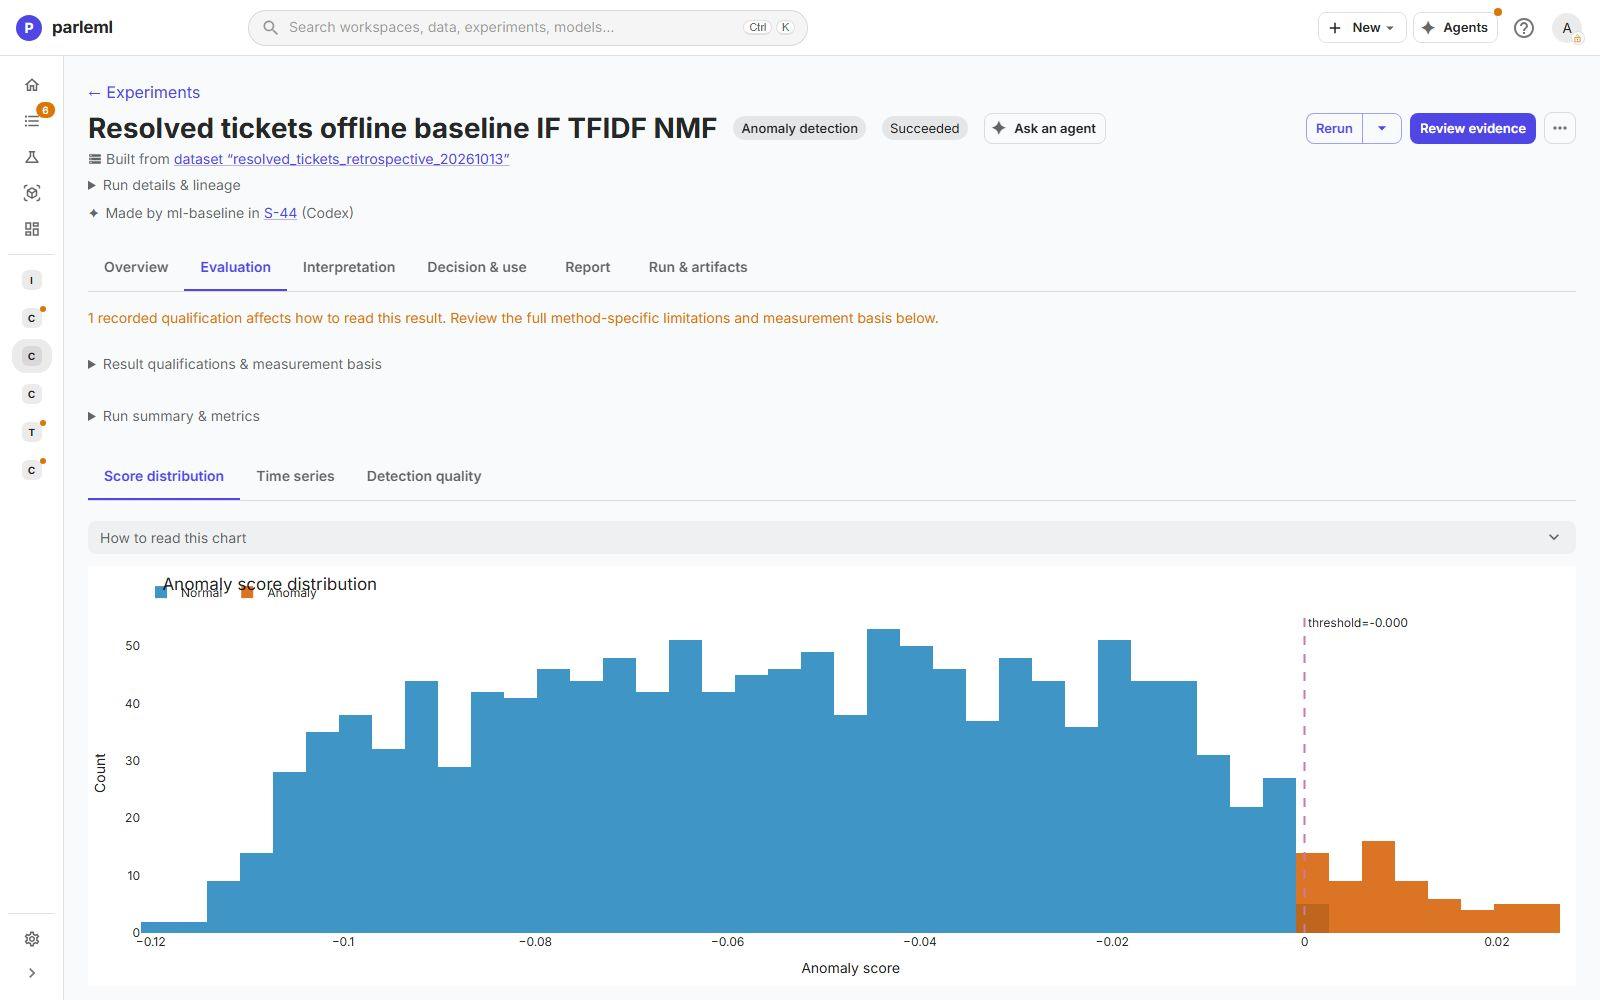
Evaluation → Quality & diagnostics:
- Score distribution: normal and unusual rows, with the threshold.
- Time series: the anomaly score over time, when the run has a time column.
- Detector agreement: for the top rows, which of the candidate detectors flagged each one, when the detector was chosen automatically.
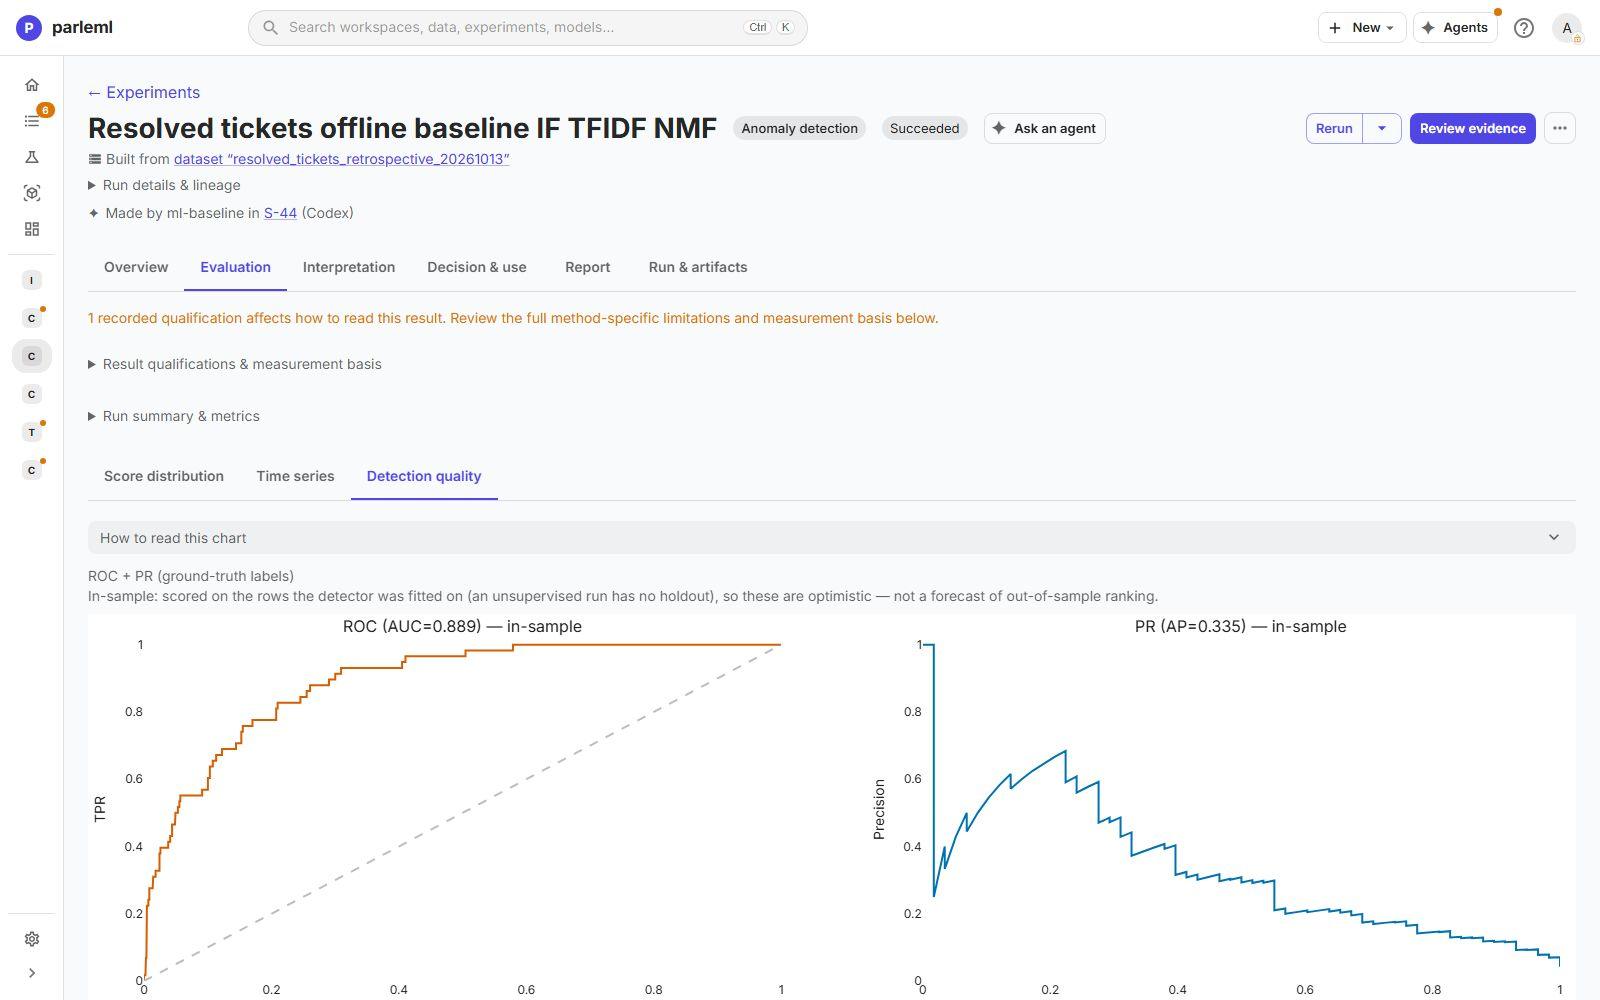
- Detection quality: ROC and PR curves, when you gave a label column. Here ROC-AUC is 0.889 and average precision 0.335. These curves are marked in-sample: an unsupervised run has no holdout, so they are optimistic.
Interpretation → Patterns & explanations:
- Anomaly map: a 2-D projection of the rows, coloured flagged or normal. It is drawn for display only; the detector never saw these coordinates.
- Explanations (per feature): how unusual each field is, for any pair of features.
- Top-K: the highest-scoring rows with their full text. Open any one.
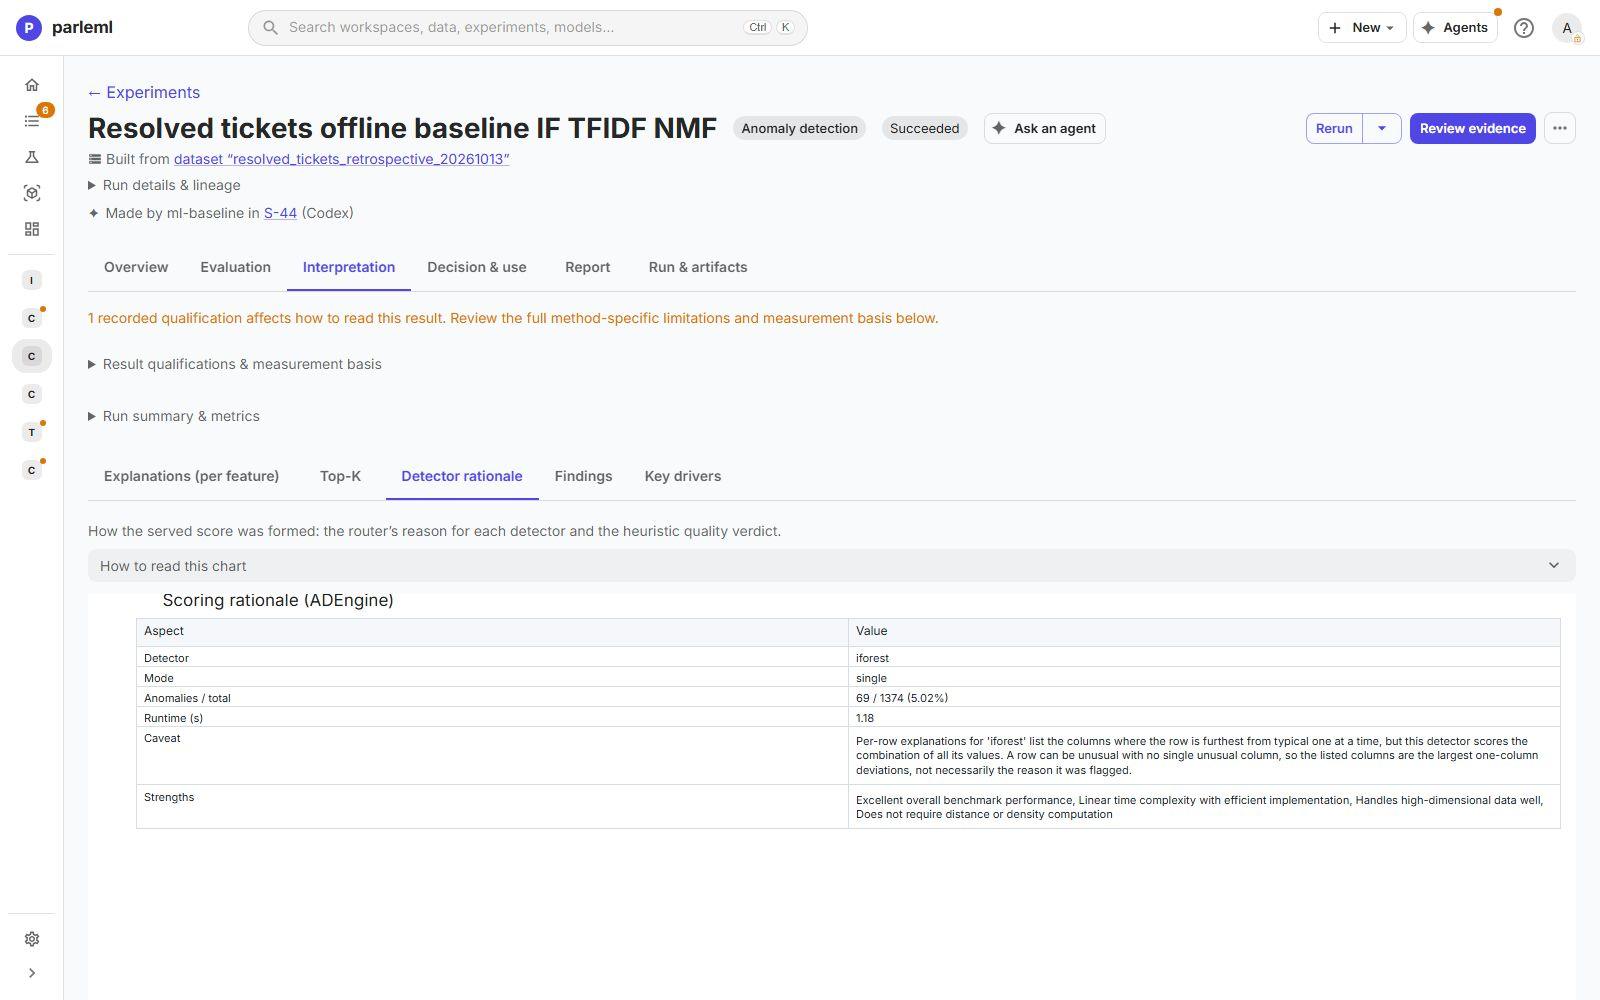
- Detector rationale: which detector produced the score and why, its strengths and caveats, and its runtime.
- Findings: the fields that contributed for each flagged row.
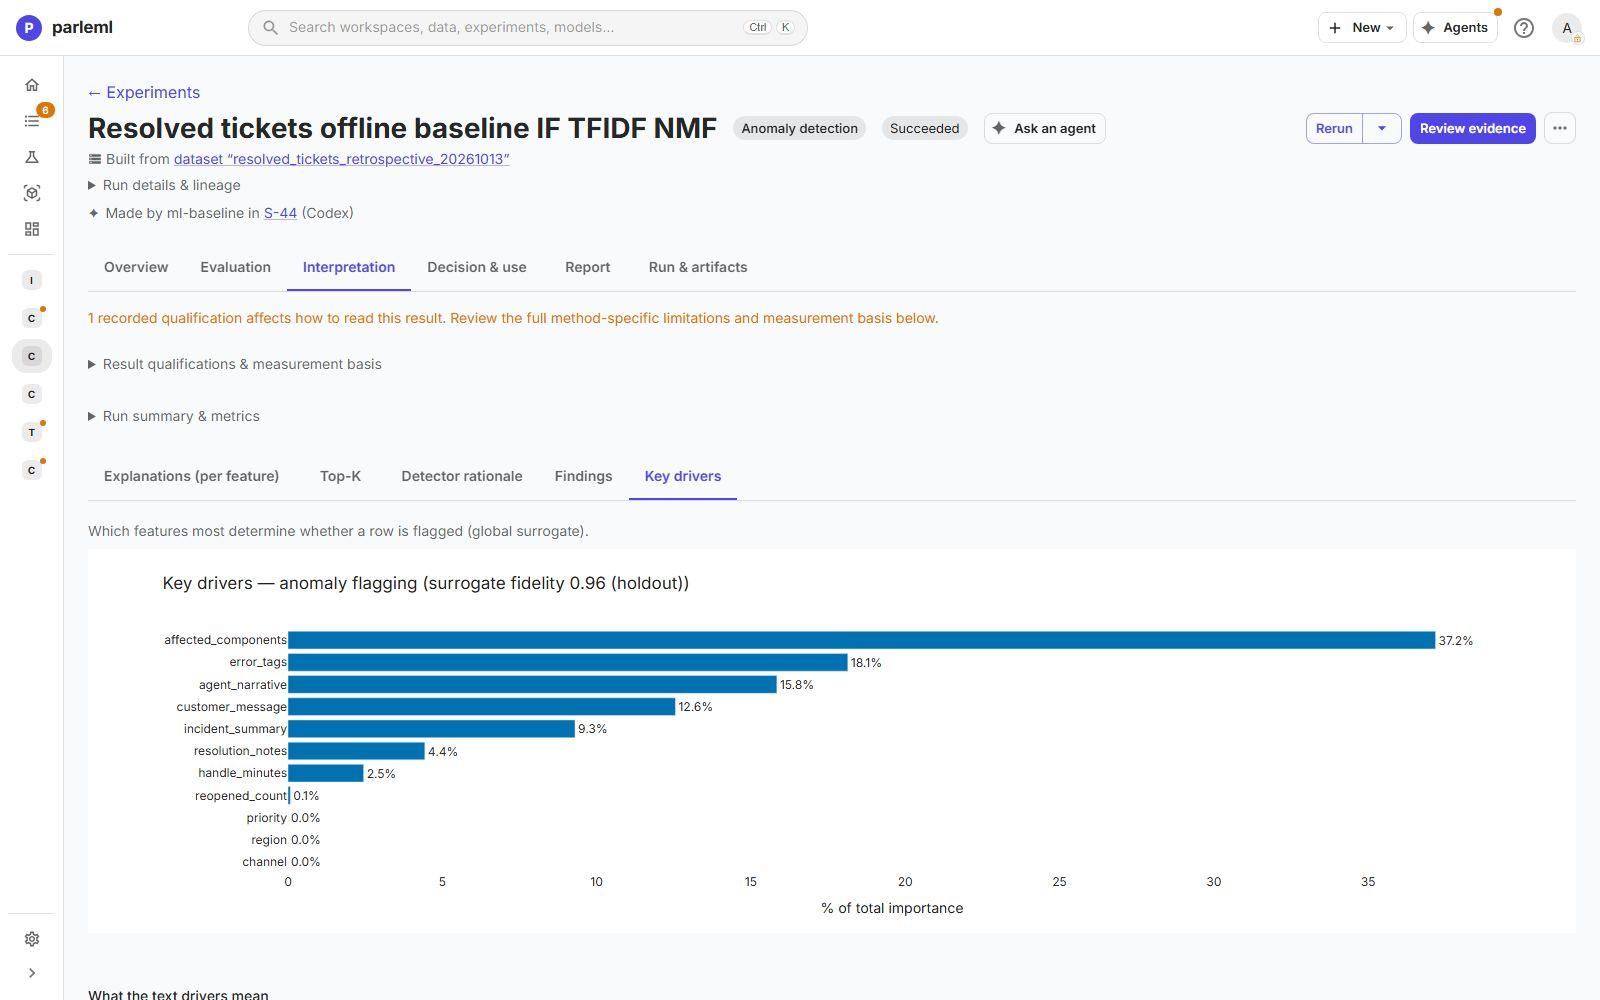
- Key drivers: a surrogate model of what decides flagging, with its fidelity (here 0.96 on a holdout).
A detector scores the combination of a row's values. So a row can be unusual with no single unusual field, and the page says so.
Decision & use → Decision & scoring:
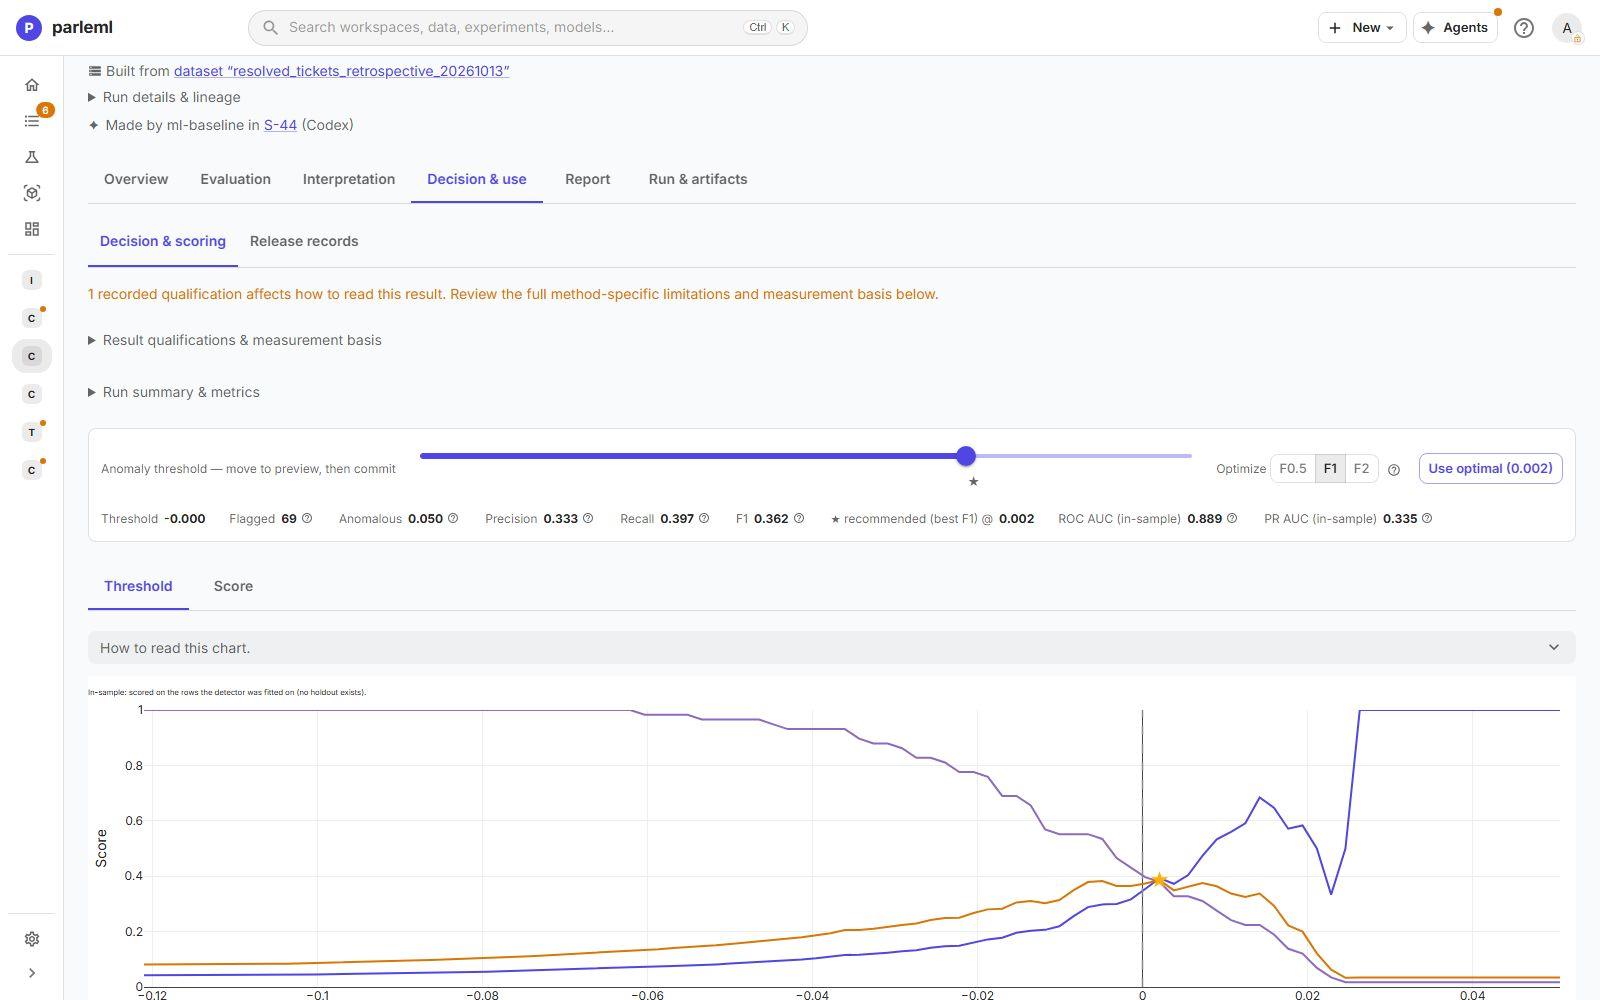
- Threshold: move it to preview how many rows are flagged and, with a label, the precision, recall and F1. Then commit it. A recommended threshold is marked.
- Score: pick a row or type values, and see its anomaly score.
Clustering
Example: customer personas with k-means on robustly scaled features.
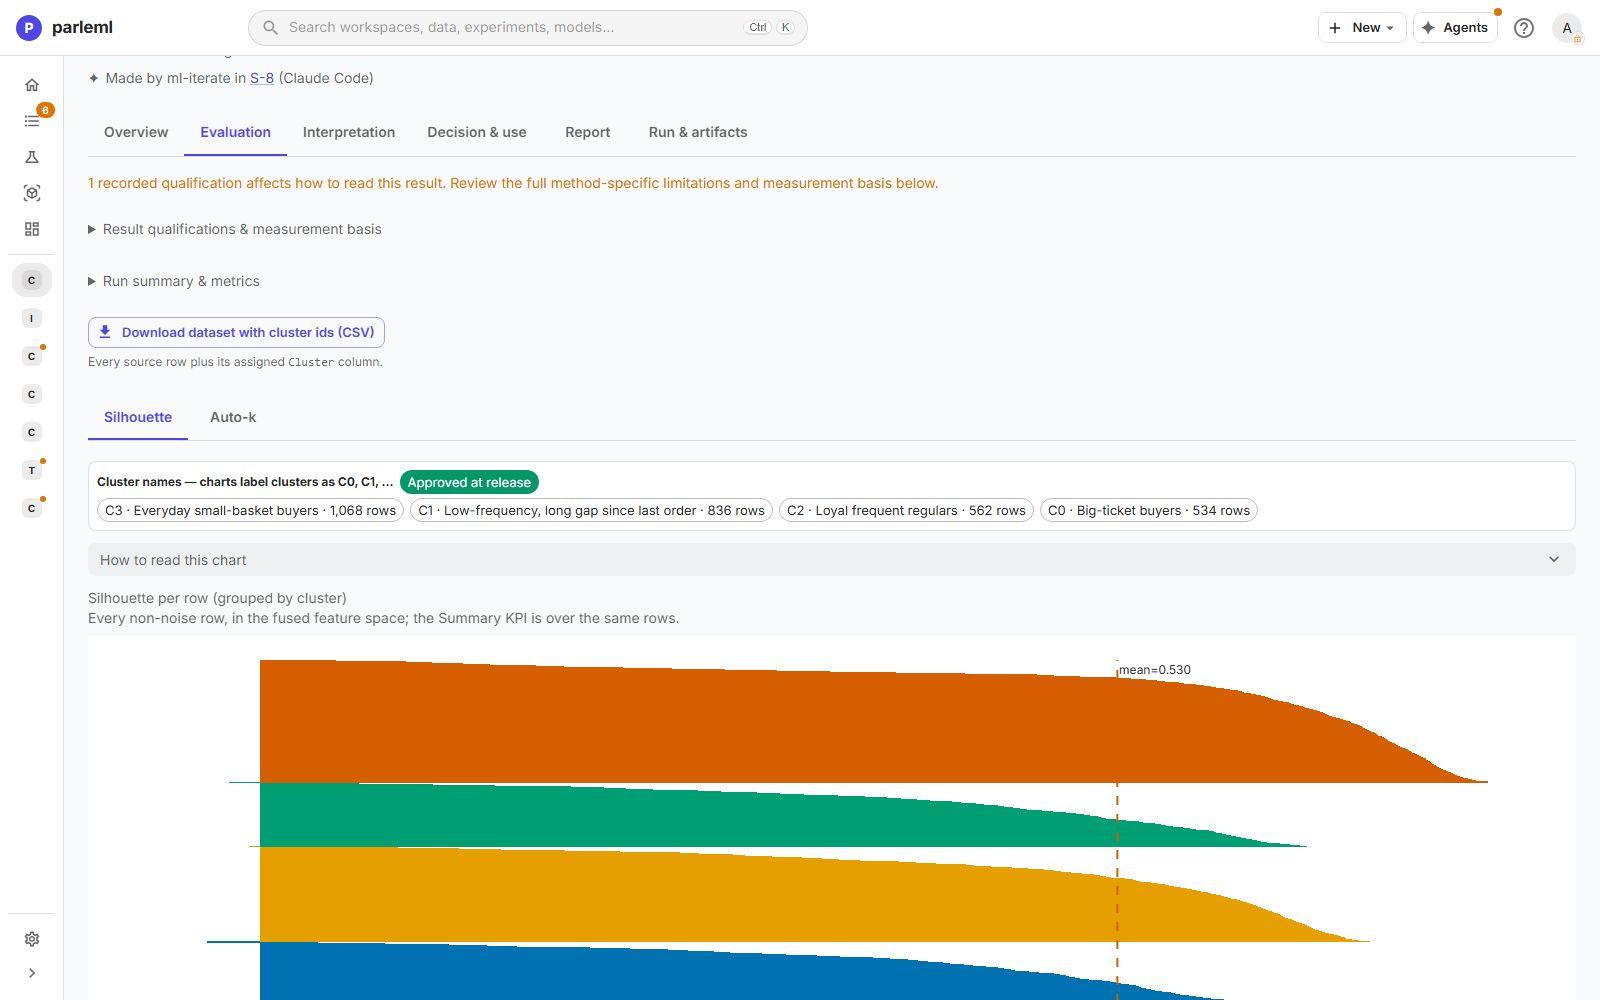
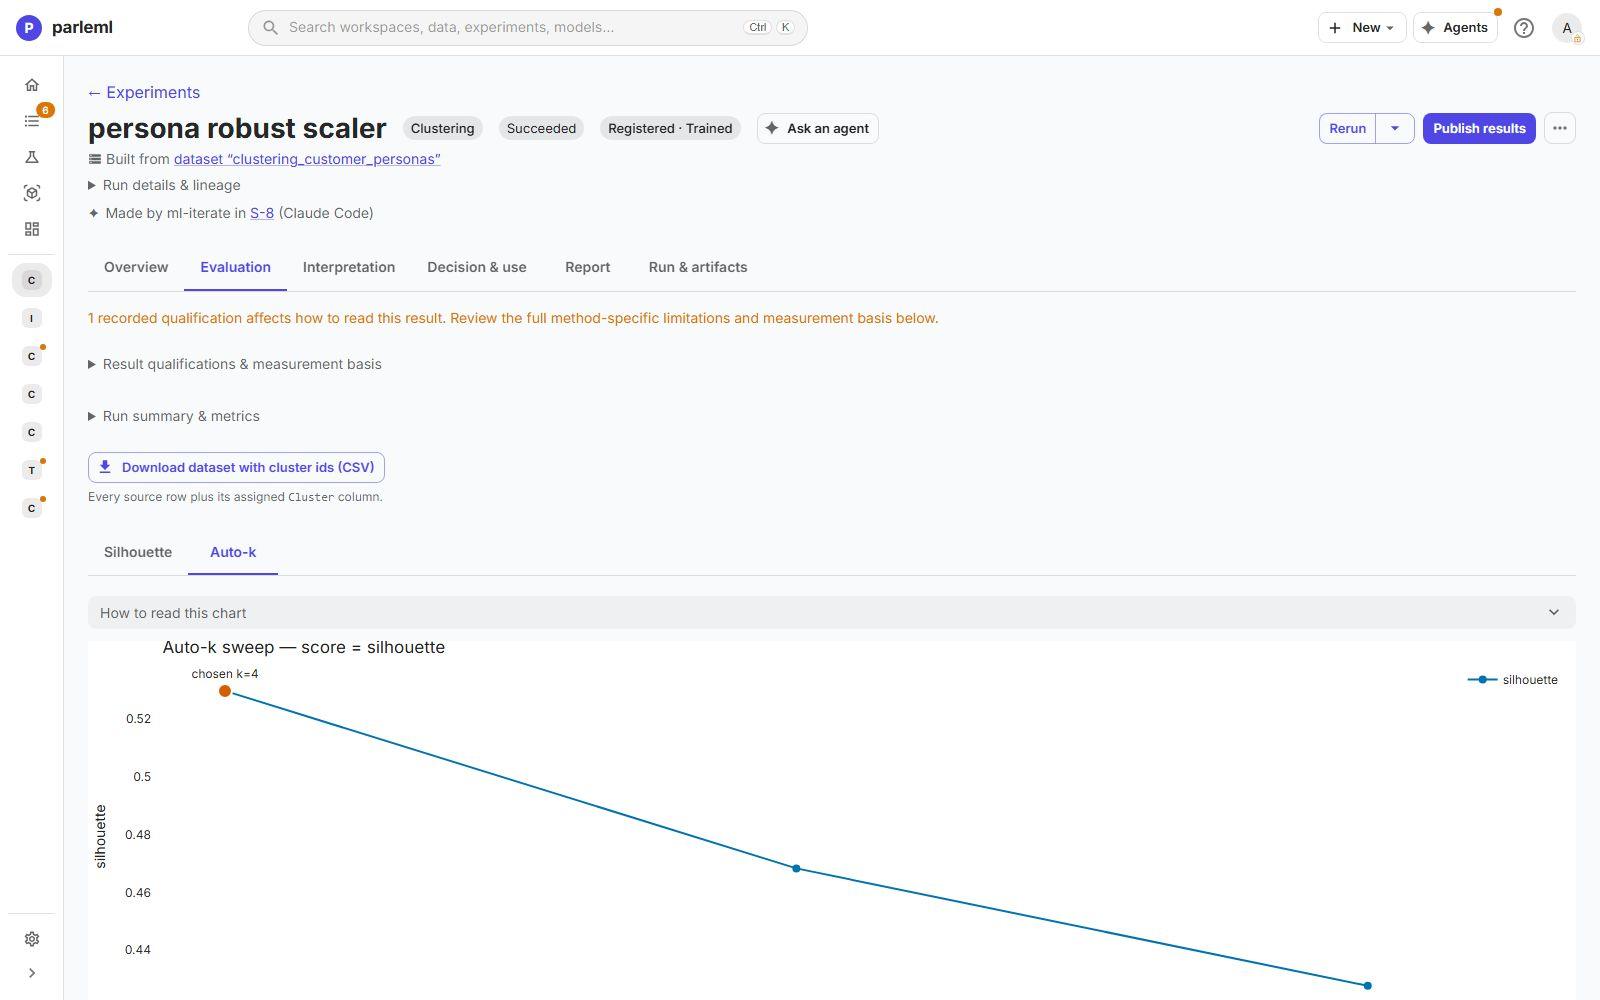
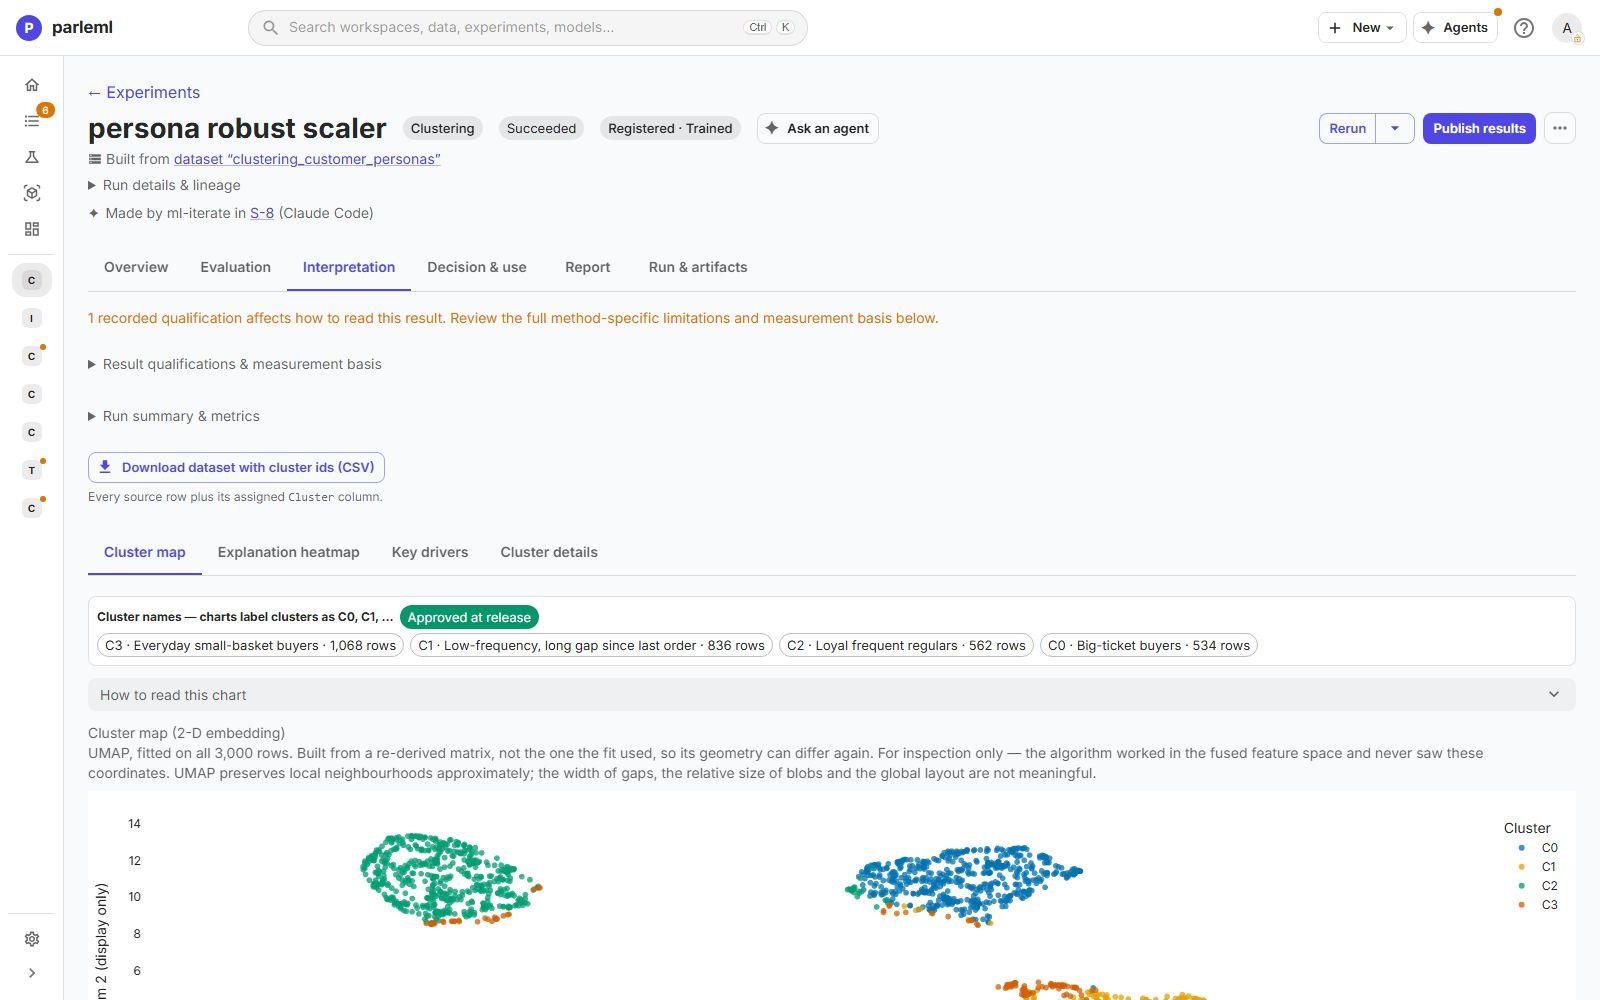
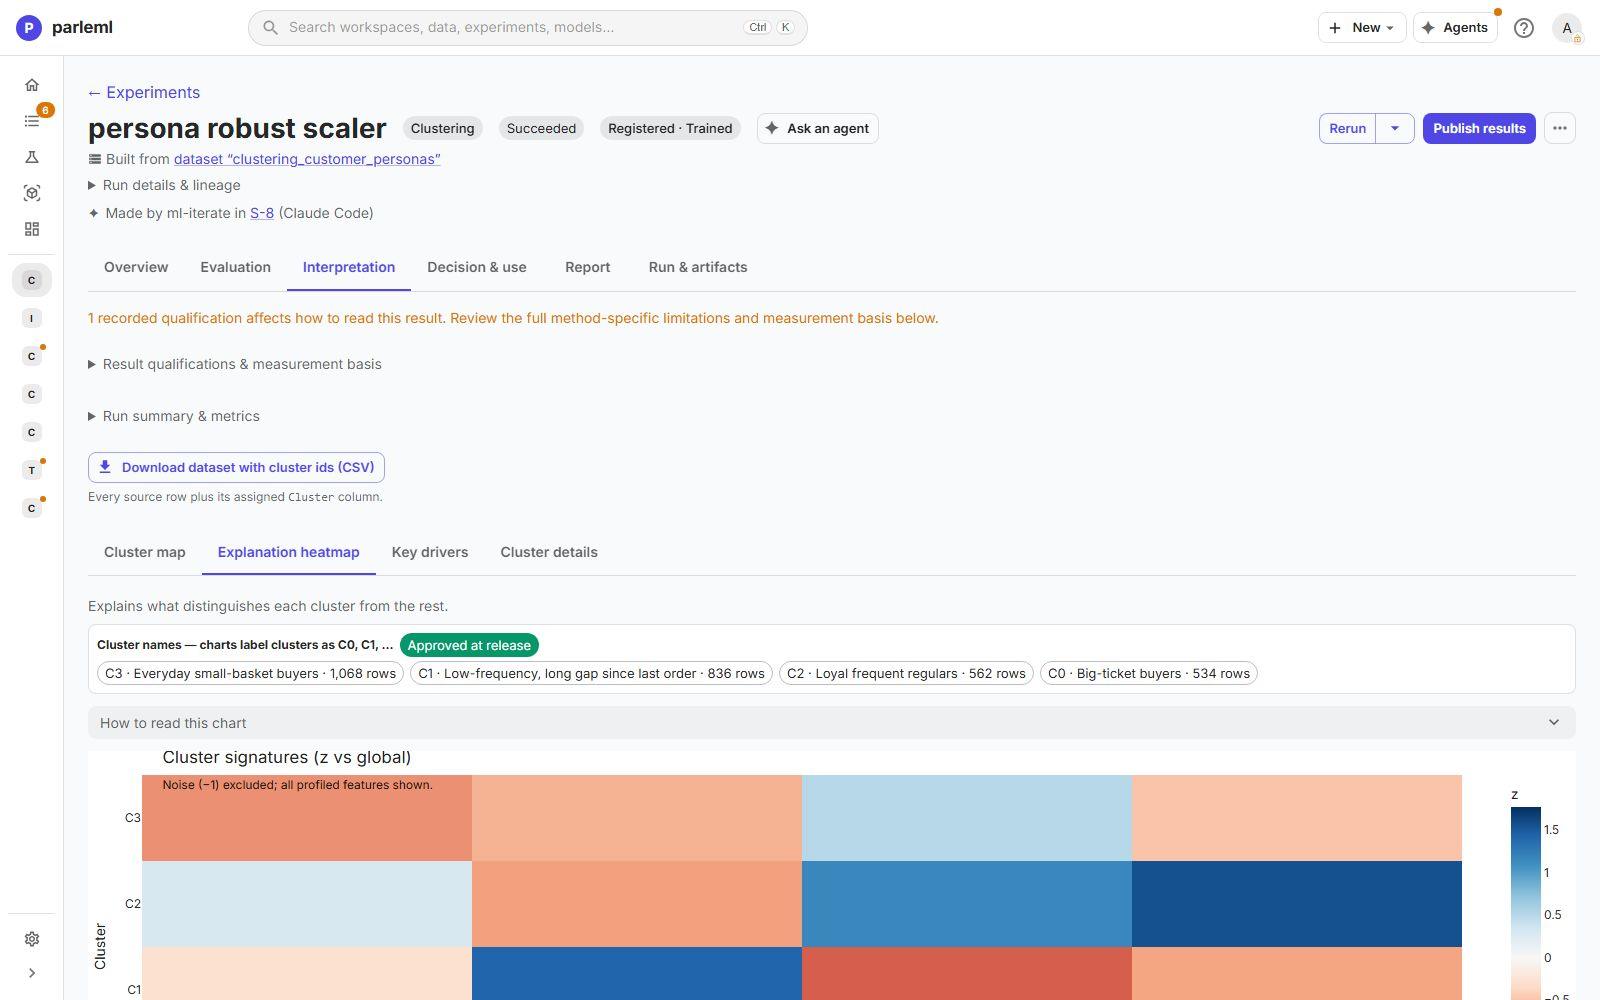
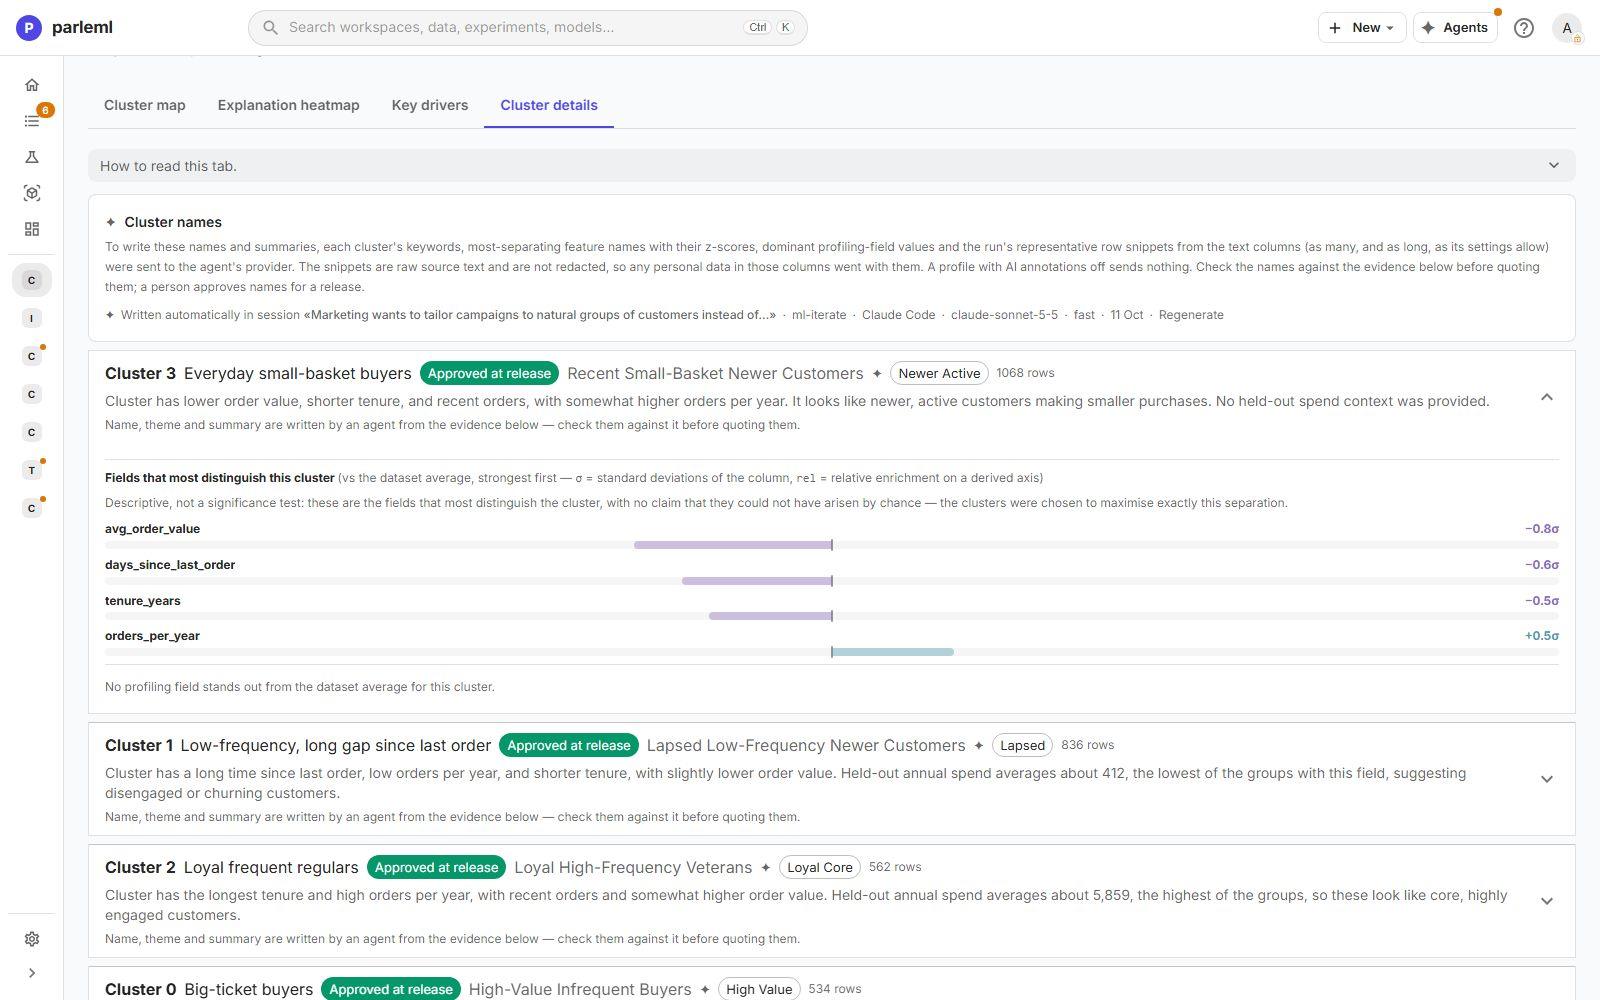
Overview: 4 groups in 3,000 rows, no noise points, and a silhouette of 0.53. Each cluster has a name written from its profile. Here the names were approved at release: Everyday small-basket buyers, Low-frequency, long gap since last order, Loyal frequent regulars and Big-ticket buyers. Download dataset with cluster ids (CSV) exports every source row with its cluster.
Evaluation → Quality & diagnostics:
- Silhouette: how well each row sits in its cluster, row by row.
- Auto-k: the sweep that chose the number of clusters, and its score at each k. The best of many candidates looks better than the typical one, and the page says how much of the gap is search.
Interpretation → Patterns & explanations:
- Cluster map: a 2-D projection of every row, coloured by cluster. It is marked for inspection only: gap widths and blob sizes in a projection mean nothing.
- Explanation heatmap: what sets each cluster apart from the rest.
- Key drivers: the columns that most account for the grouping.
- Cluster details: one card per cluster, with its size, distinguishing features with z-scores, profile fields and the evidence its name was written from.
Decision & use → Decision & scoring → Score places a new record in a cluster: pick a row or type values. This needs an algorithm that can assign new rows, such as k-means. DBSCAN, HDBSCAN and agglomerative clustering only group the rows they were fitted on, so their runs are export-only.
Recommendation
Example: the next product to offer telecom customers, as a top-5 list.
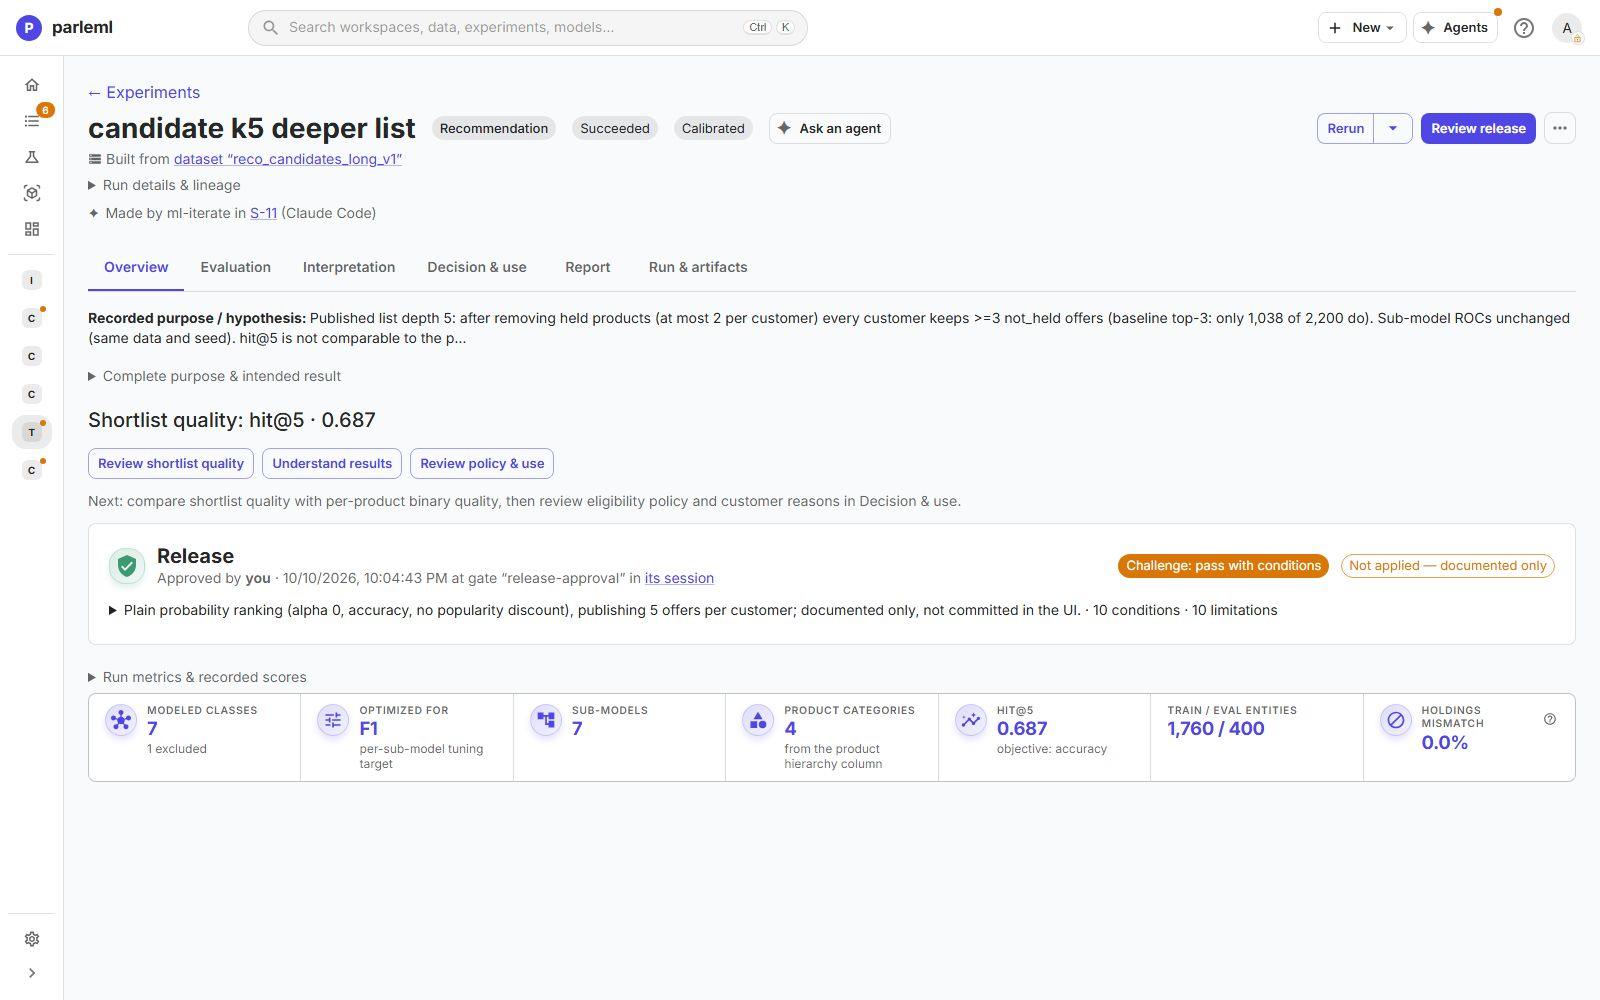
A recommendation experiment trains one model per product (one-vs-rest) and ranks the products for each customer.
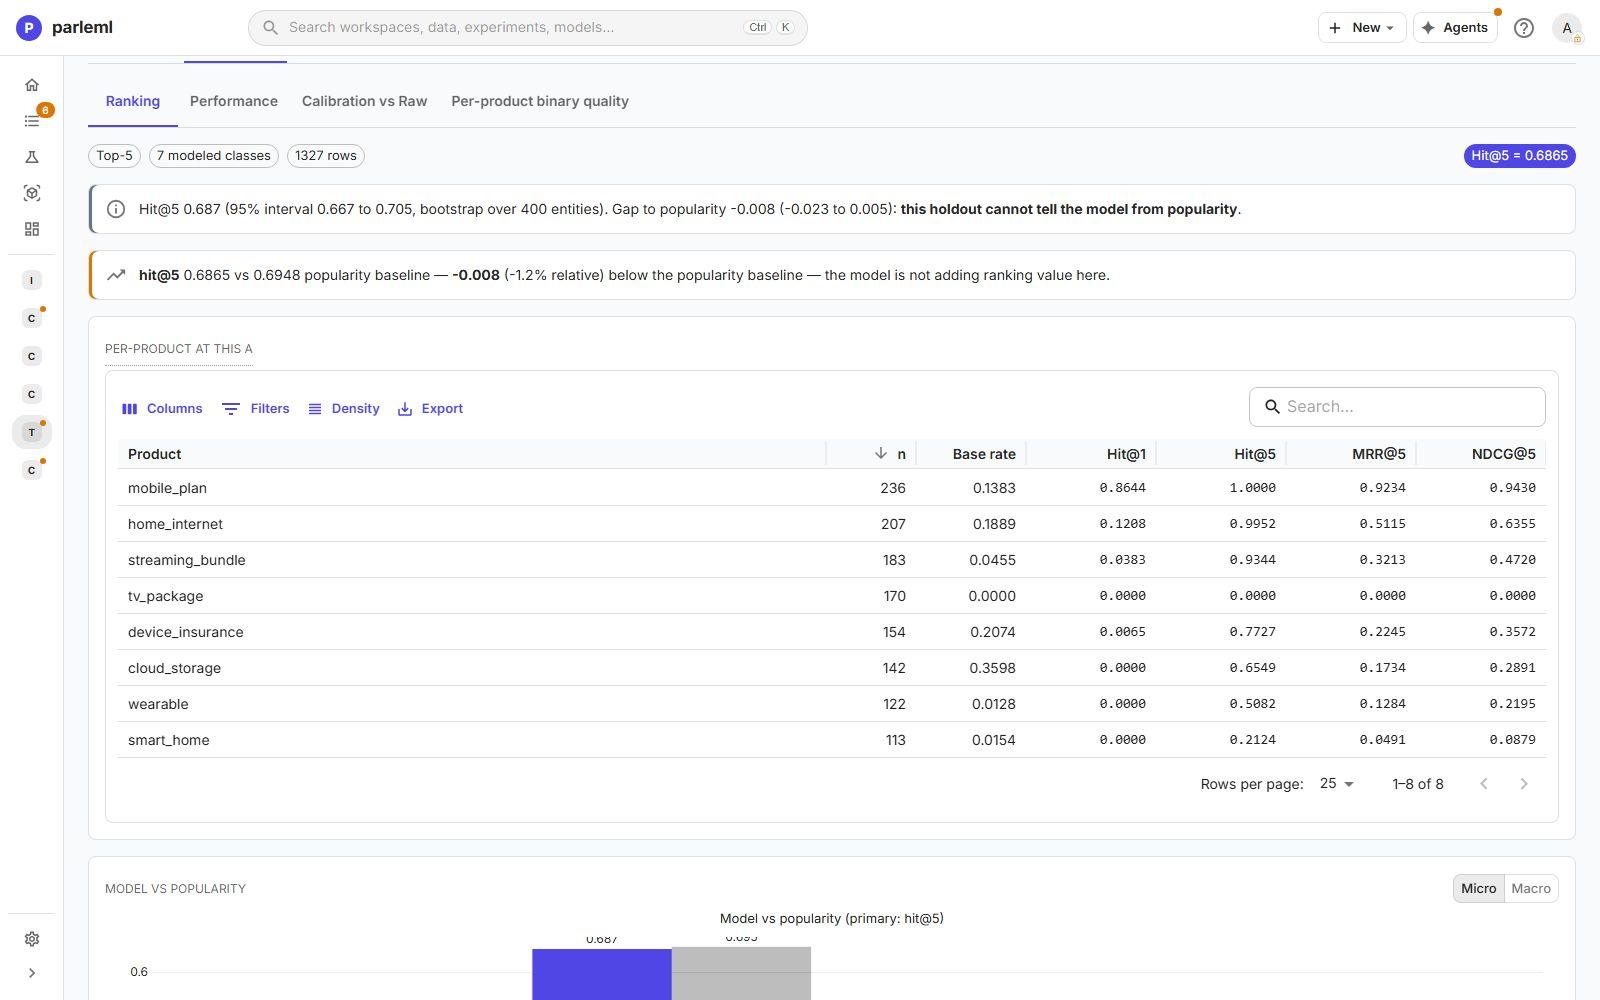
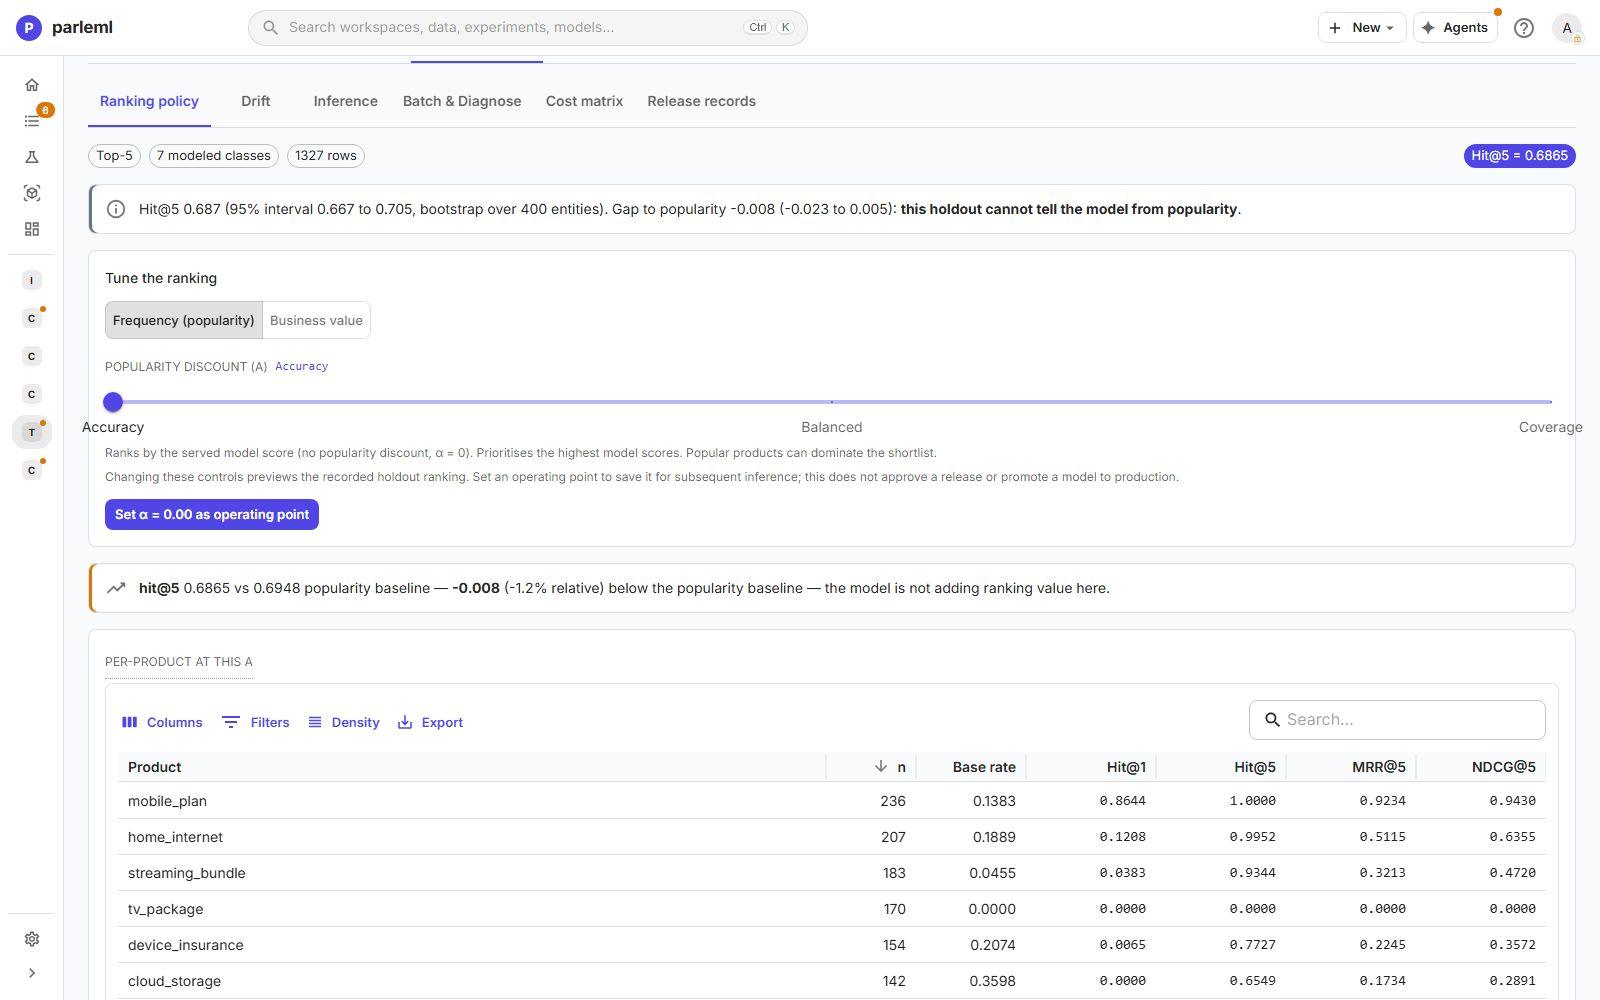
Evaluation → Ranking is the headline. It gives the list metric (Hit@5 = 0.687, with a bootstrap interval) and compares it with popularity: always offering the most popular products. Here the gap is −0.008, inside its interval, and the page says so plainly: this holdout cannot tell the model from popularity. Per-product rows give Hit@1, Hit@5, MRR and NDCG.
Evaluation also has:
- Performance and Calibration vs Raw, as for a multiclass model;
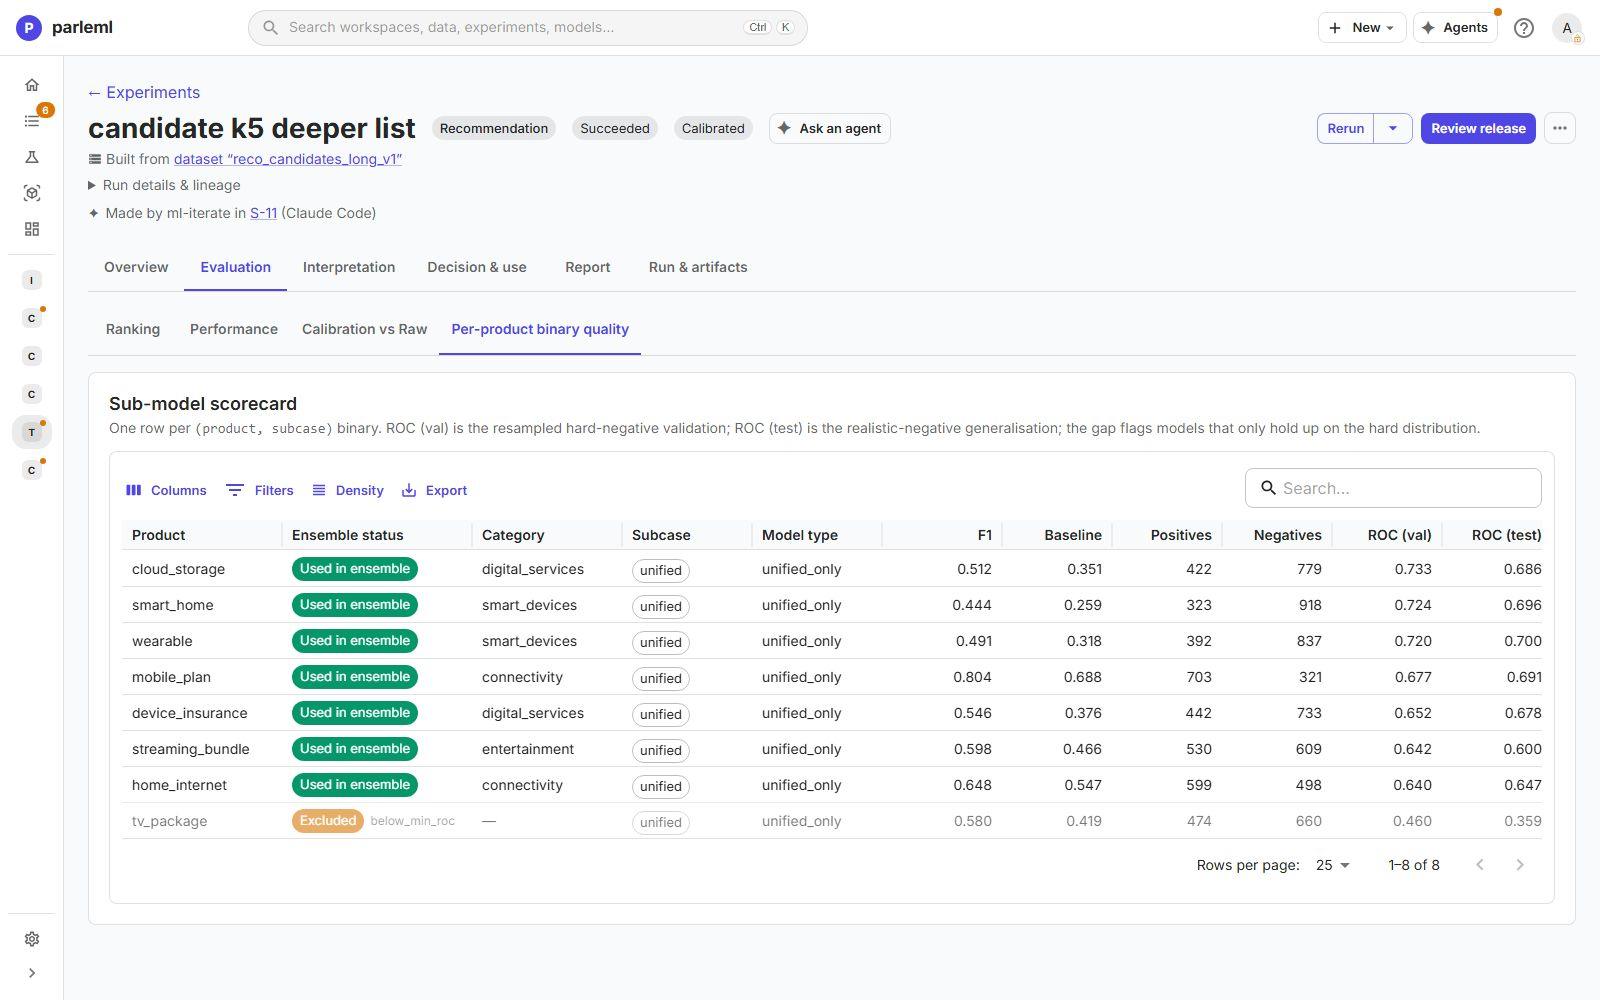
- Per-product binary quality: a scorecard of every sub-model, one per product and subcase. It shows F1 against its baseline, positives and negatives, and ROC on two sets of negatives. A gap between the two flags models that only work on the harder, resampled negatives.
Interpretation has:
- Explain and Rules, for each product's model. Each model is explained on the customers it trained on. Its rules get their Test numbers from the customers held out for the ranking evaluation, which neither the model nor the rule search saw.
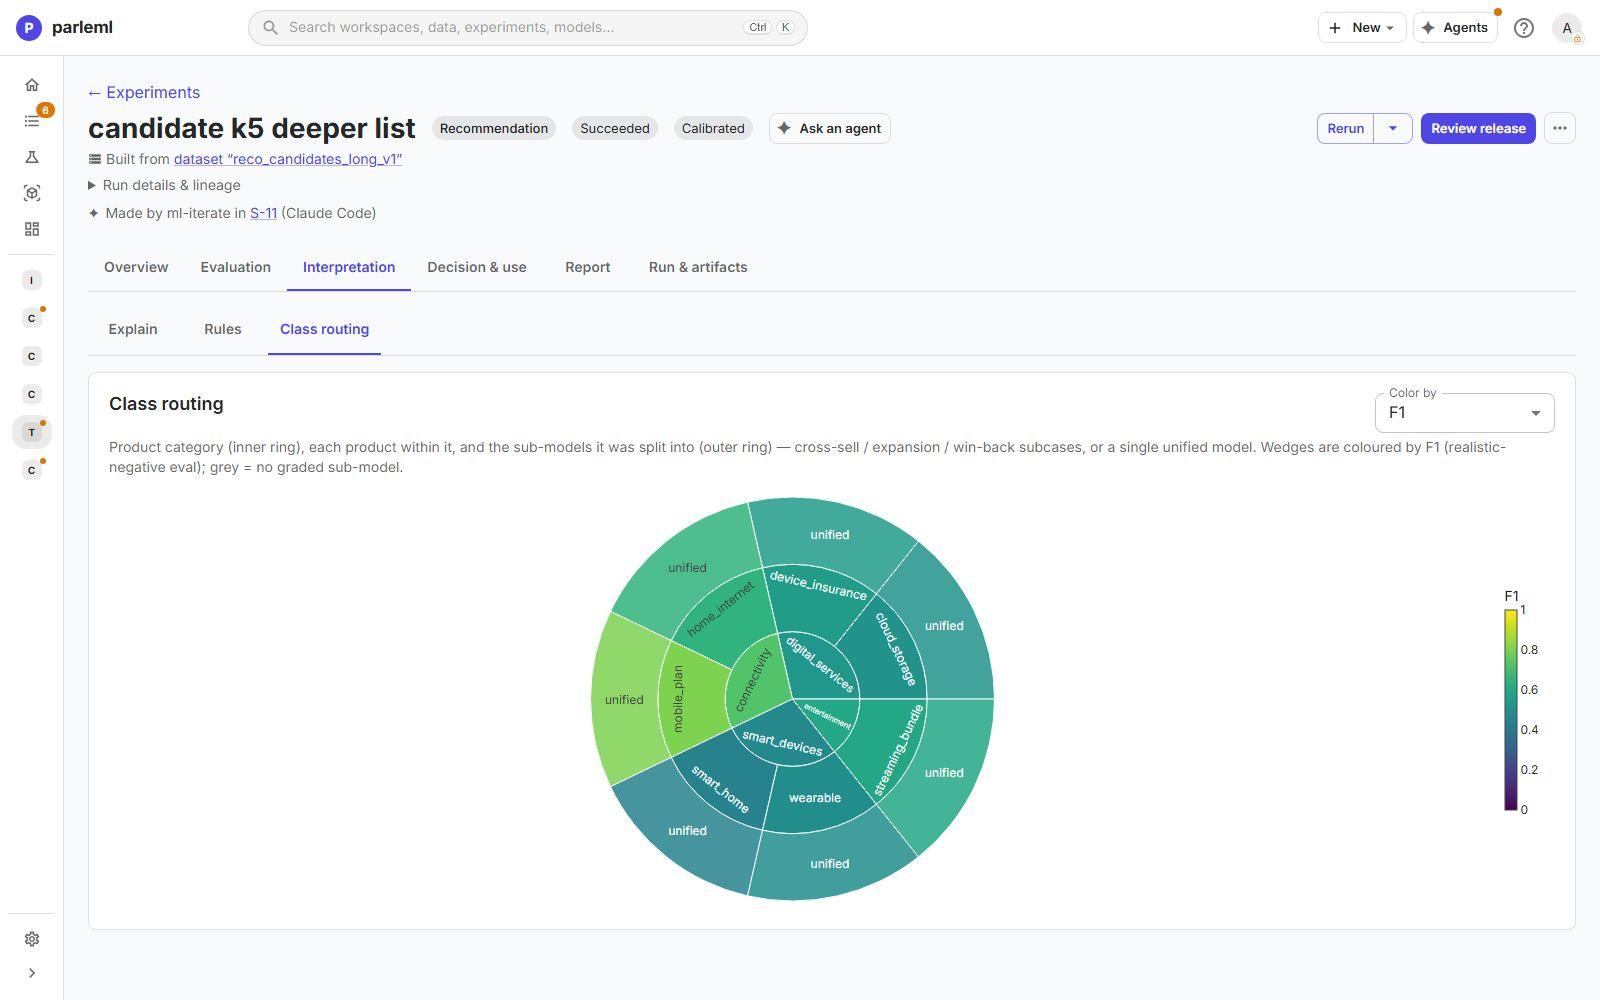
- Class routing: a sunburst of product categories, products and their sub-models (cross-sell, expansion, win-back or unified), coloured by F1.
Decision & use:
- Ranking policy tunes how the list is built. The Popularity discount (α) trades accuracy for coverage of the catalogue. Preview it on the holdout before you commit it.
- Drift gives each product's Information Value: which features separate that product's buyers from everyone else.
- Inference and Batch & Diagnose score customers.
- Cost matrix works per product: it treats "is this the next product?" as a yes/no decision for one product.
Ranking (learning to rank)
Example: one LambdaRank model ordering eight products for each decision occasion.
A ranking experiment trains a single model over all products. A decision occasion is one moment when a choice was made from a set of candidates.
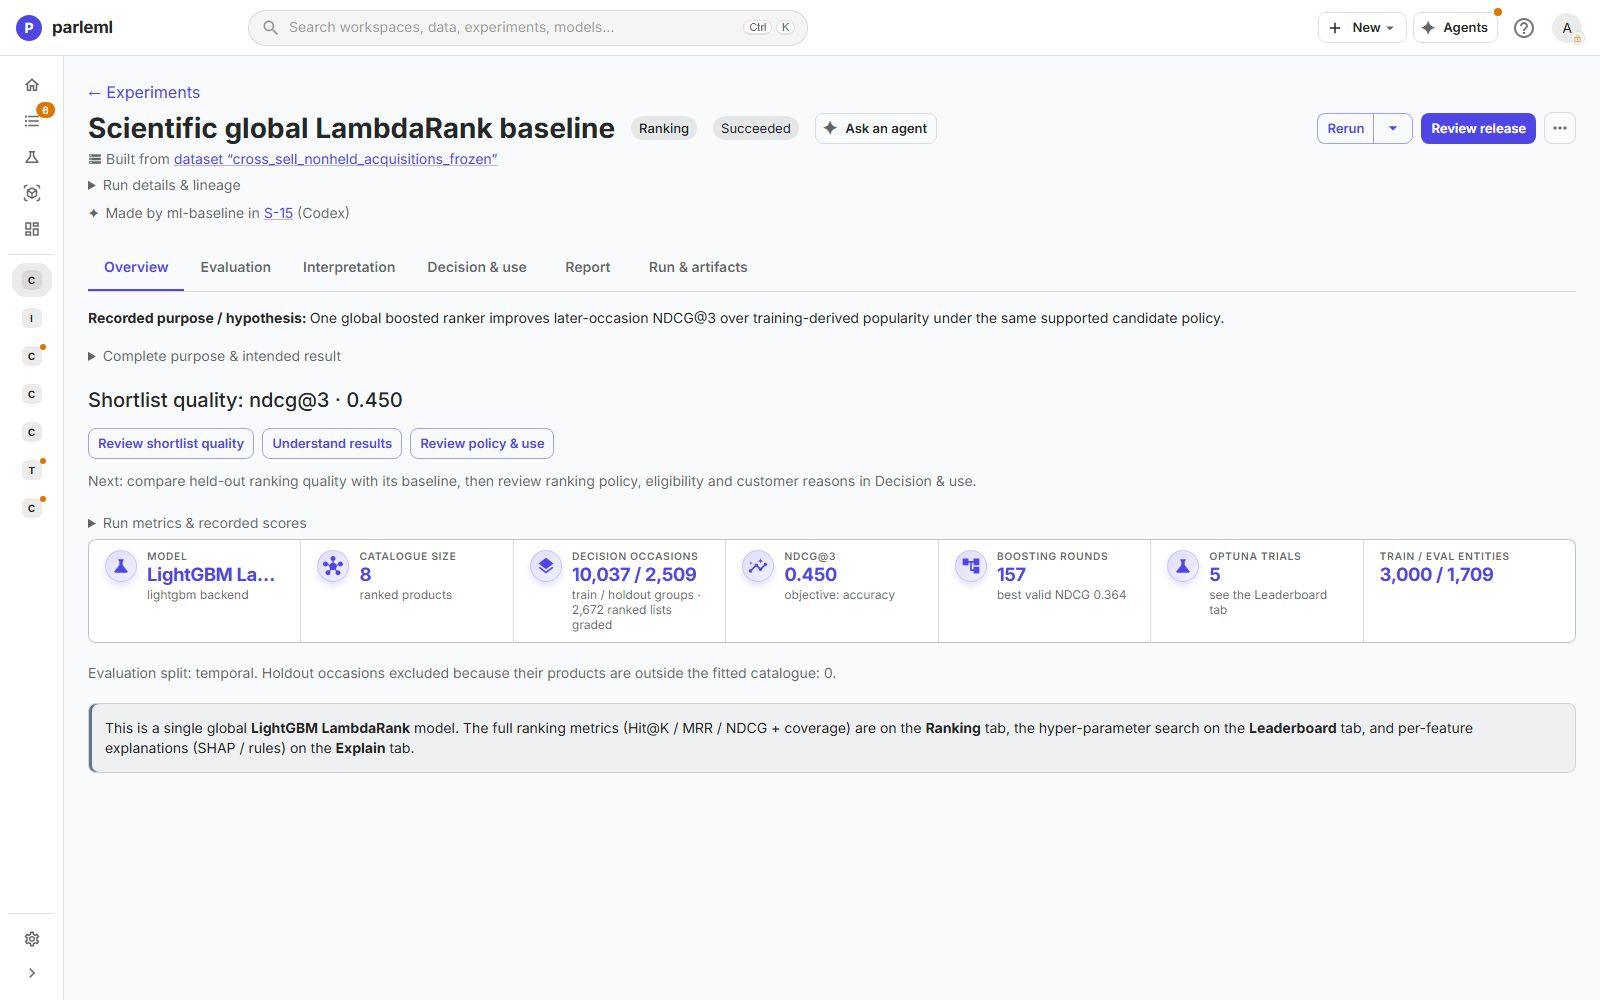
Overview: the model and backend (LightGBM LambdaRank), the catalogue size, and the decision occasions in training and holdout (10,037 and 2,509).
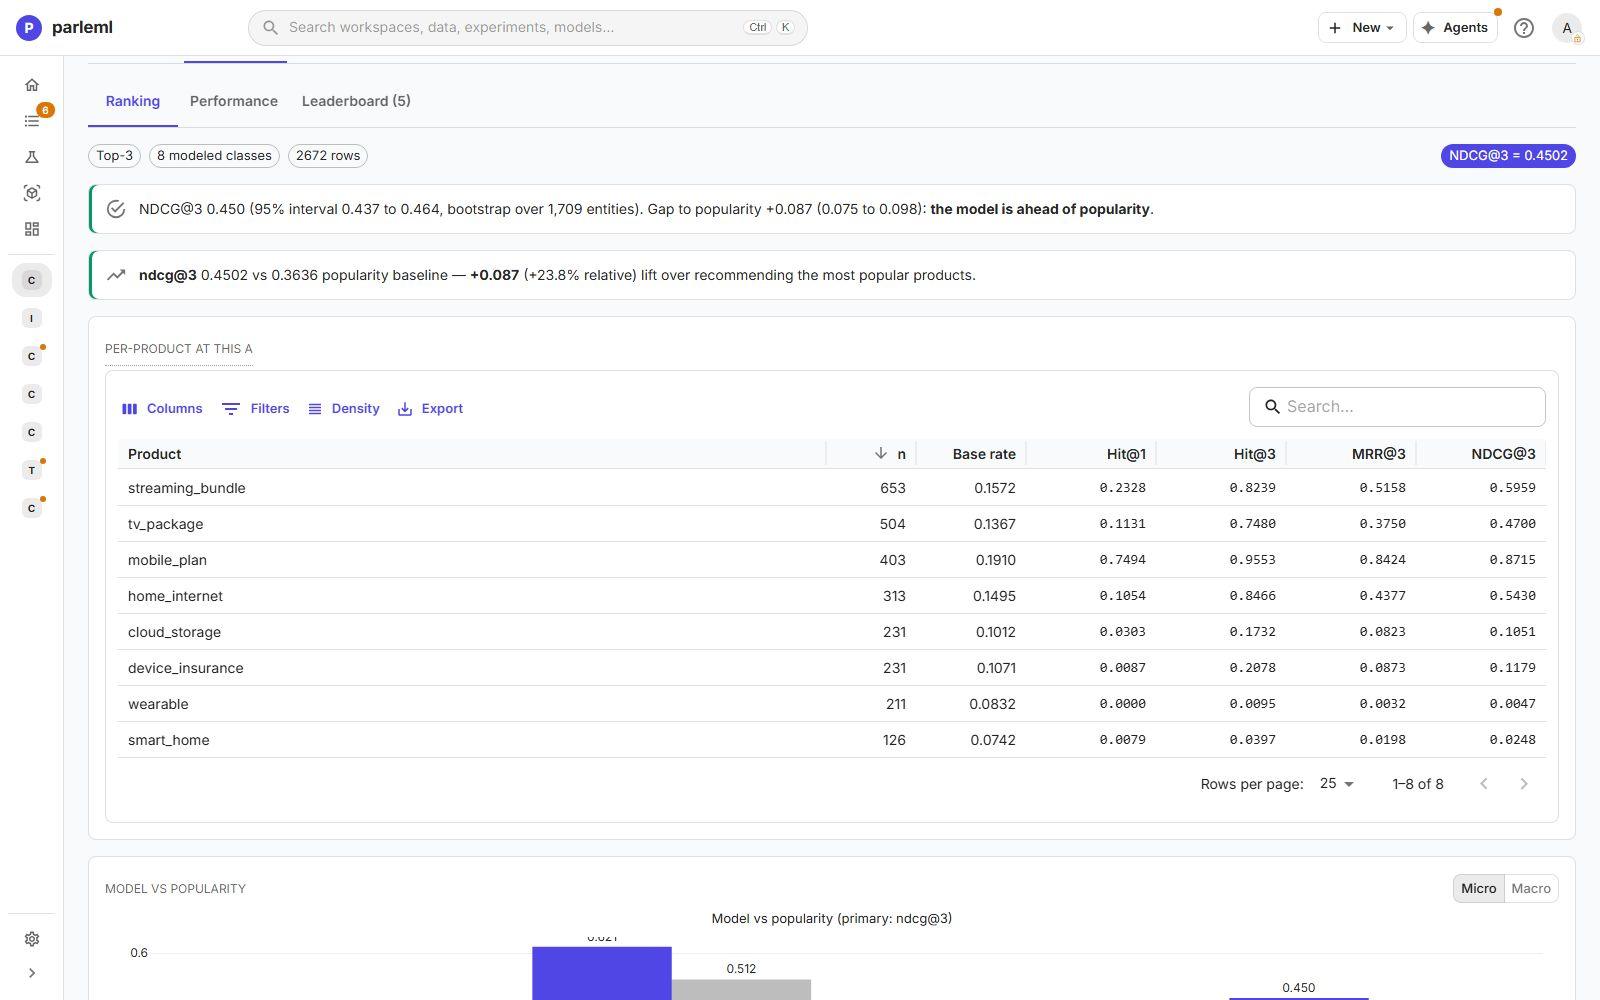
Evaluation → Ranking compares with popularity, as for recommendation. This model beats it: NDCG@3 0.450 against 0.364, +24%, with an interval that excludes zero. Leaderboard lists the search trials.
Interpretation has Explain, which profiles the ranker as an "is this the chosen product?" model, and Rules. The rules are found on the training occasions and tested on the held-out ones. Each carries Train and Test numbers and a verdict on whether it holds up.
Decision & use has Ranking policy, Inference, Batch & Diagnose and the per-product Cost matrix, as for recommendation.
Association rules
Example: market-basket rules across all store channels.
Association rules read "customers who buy A also buy B". The result is a table of rules, not a model that scores rows.
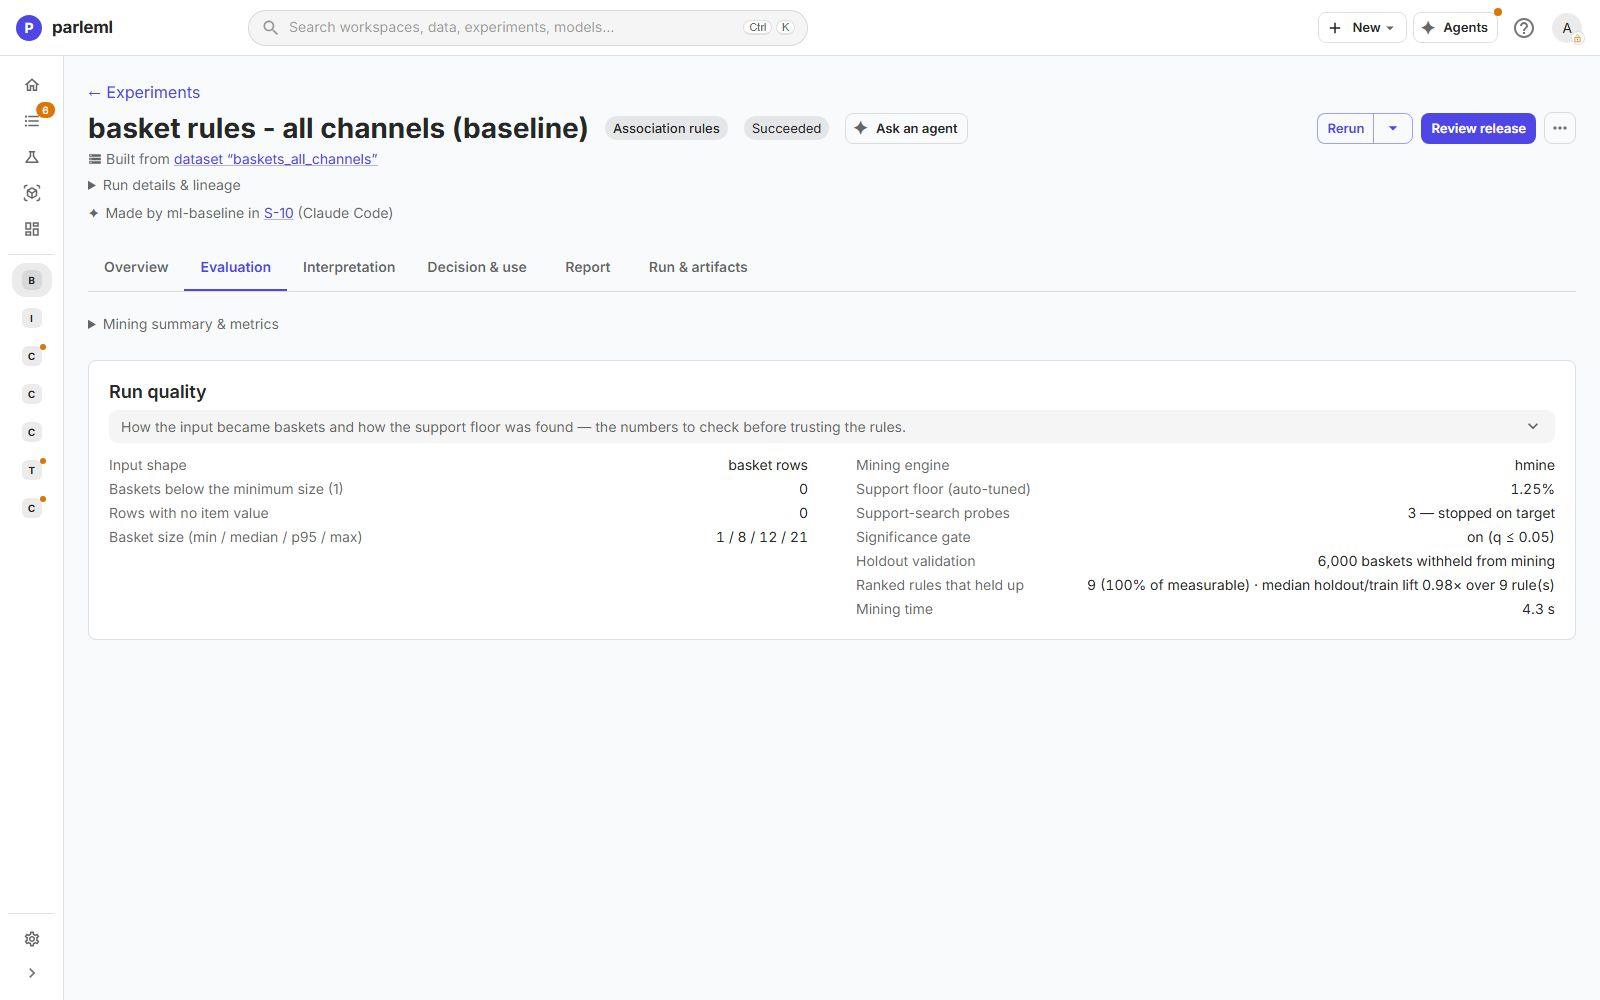
Evaluation → Run quality shows how the input became baskets and how the rules were found:
- the input shape and basket sizes (minimum, median, 95th percentile, maximum);
- the mining engine;
- the support floor, the minimum share of baskets a combination needs, tuned for you, and how many tries it took;
- the significance gate: a statistical test each rule must pass (q ≤ 0.05);
- the baskets withheld from mining to check the rules (6,000);
- how many ranked rules held up on them: 9 of 9, at a median holdout-to-train lift of 0.98.
Interpretation:
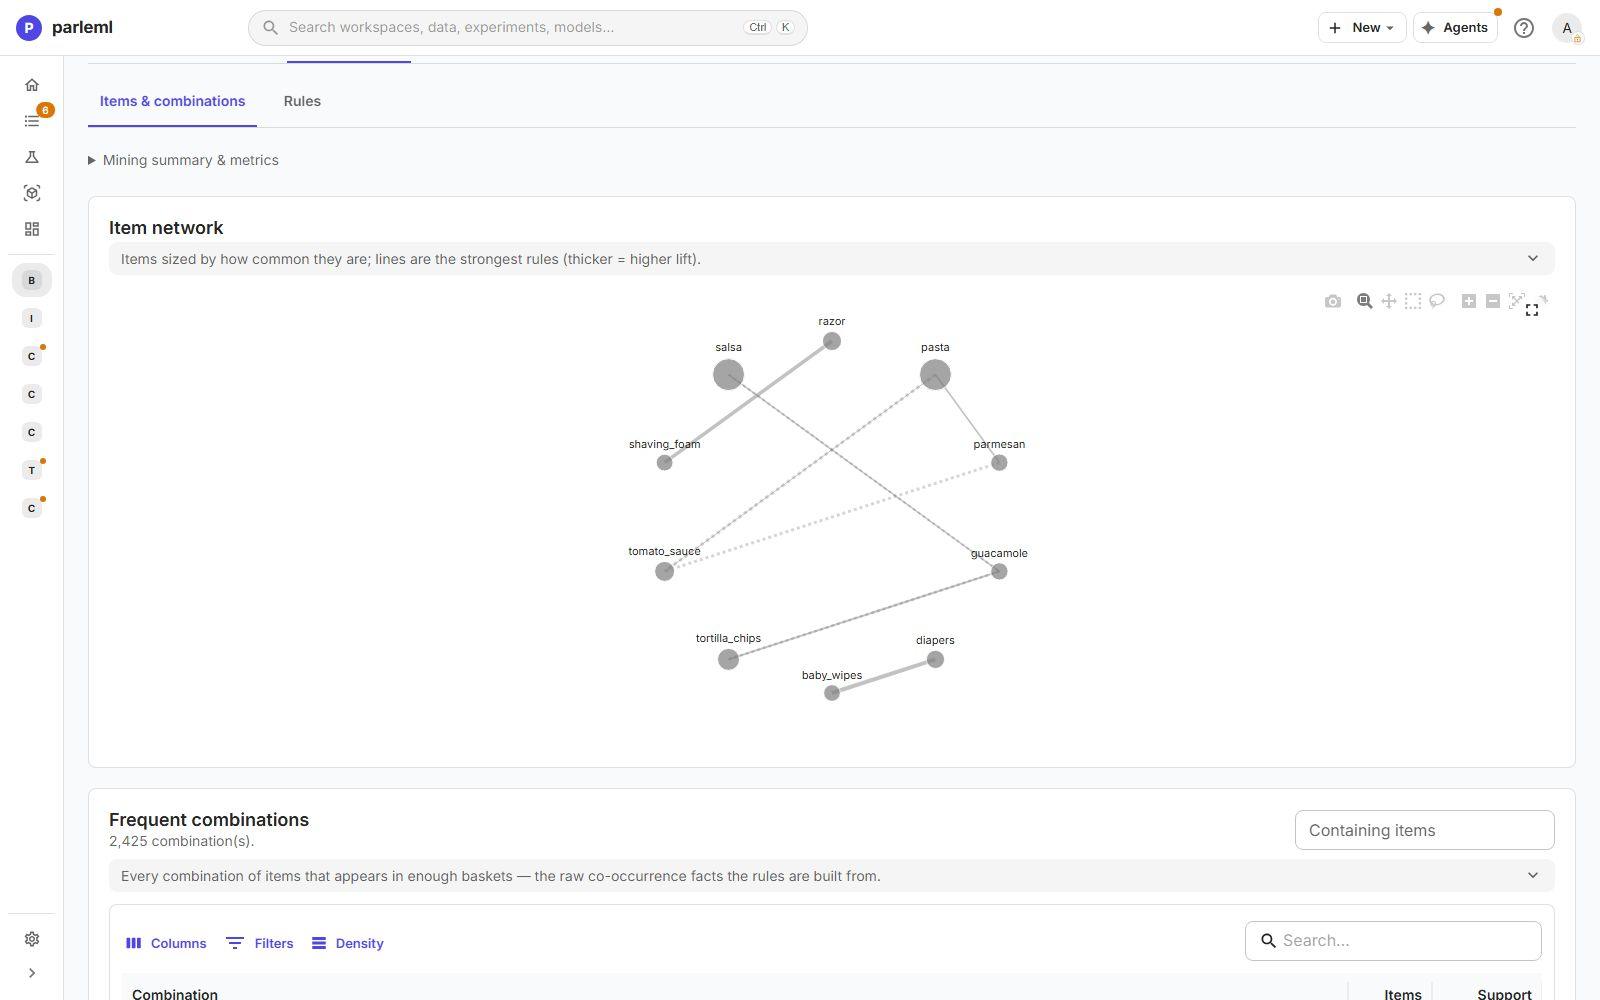
- Items & combinations: the Item network, where each item is sized by how often it is bought and lines are the strongest rules (thicker means higher lift). Below it, every frequent combination with its support.
- Rules: one row per rule, with support, confidence, lift, significance and holdout numbers. Select a rule to see real example baskets. Use Approved shortlist only, Significant only, Include redundant and Focus on items to narrow the table.
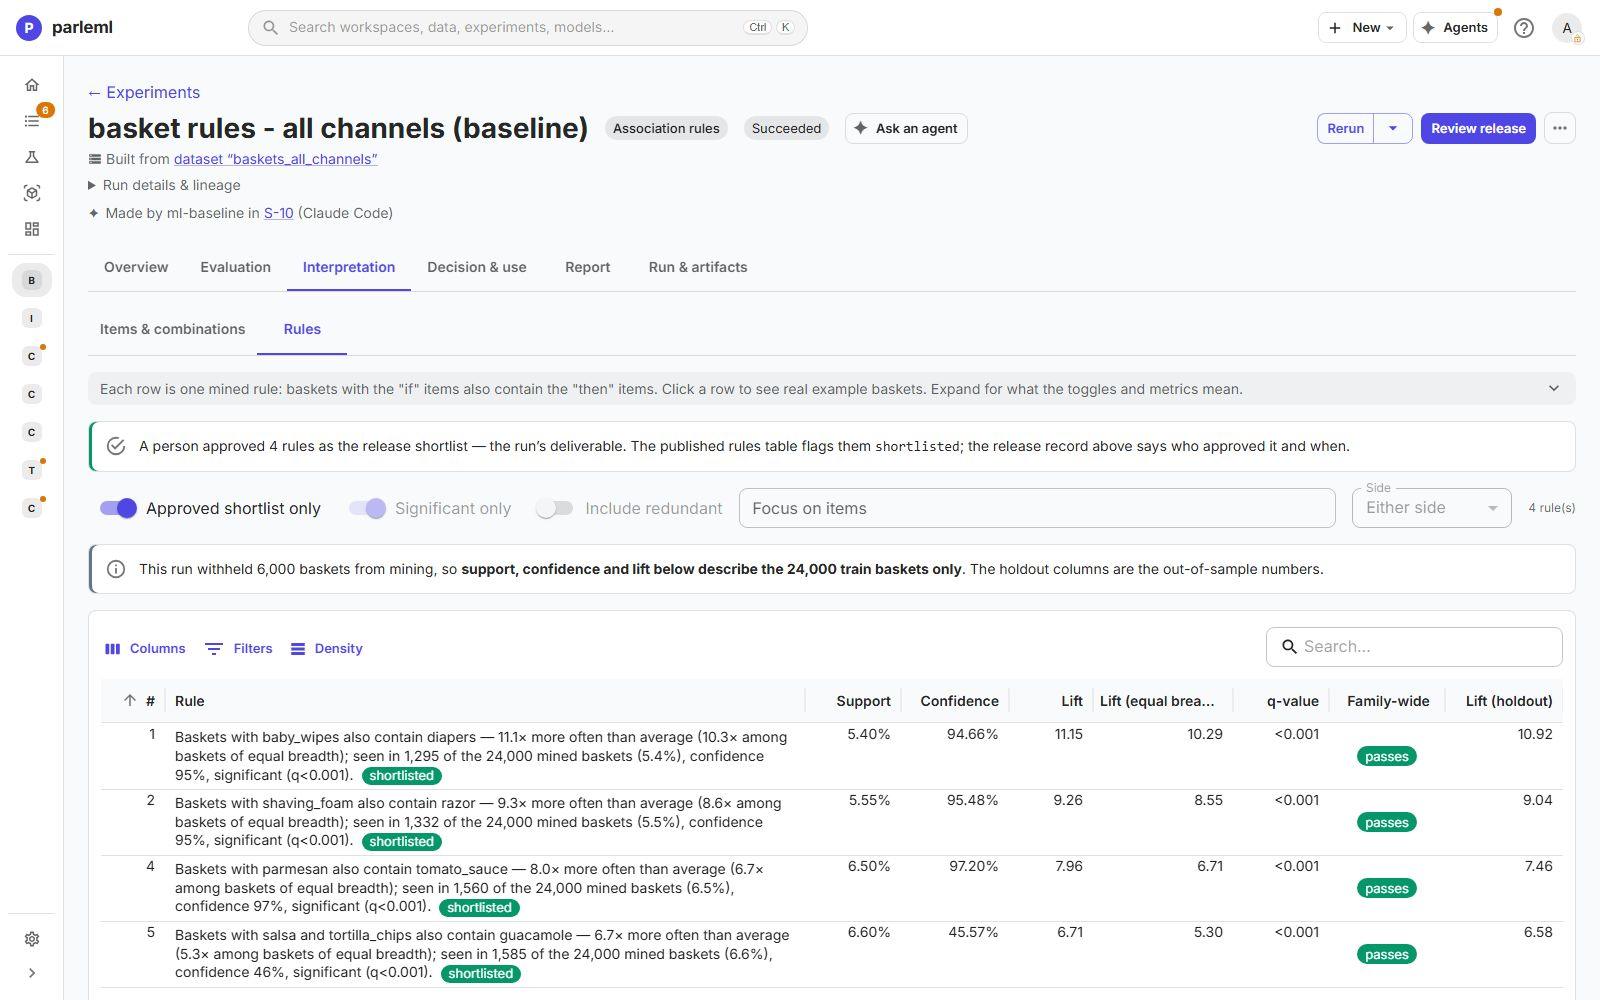
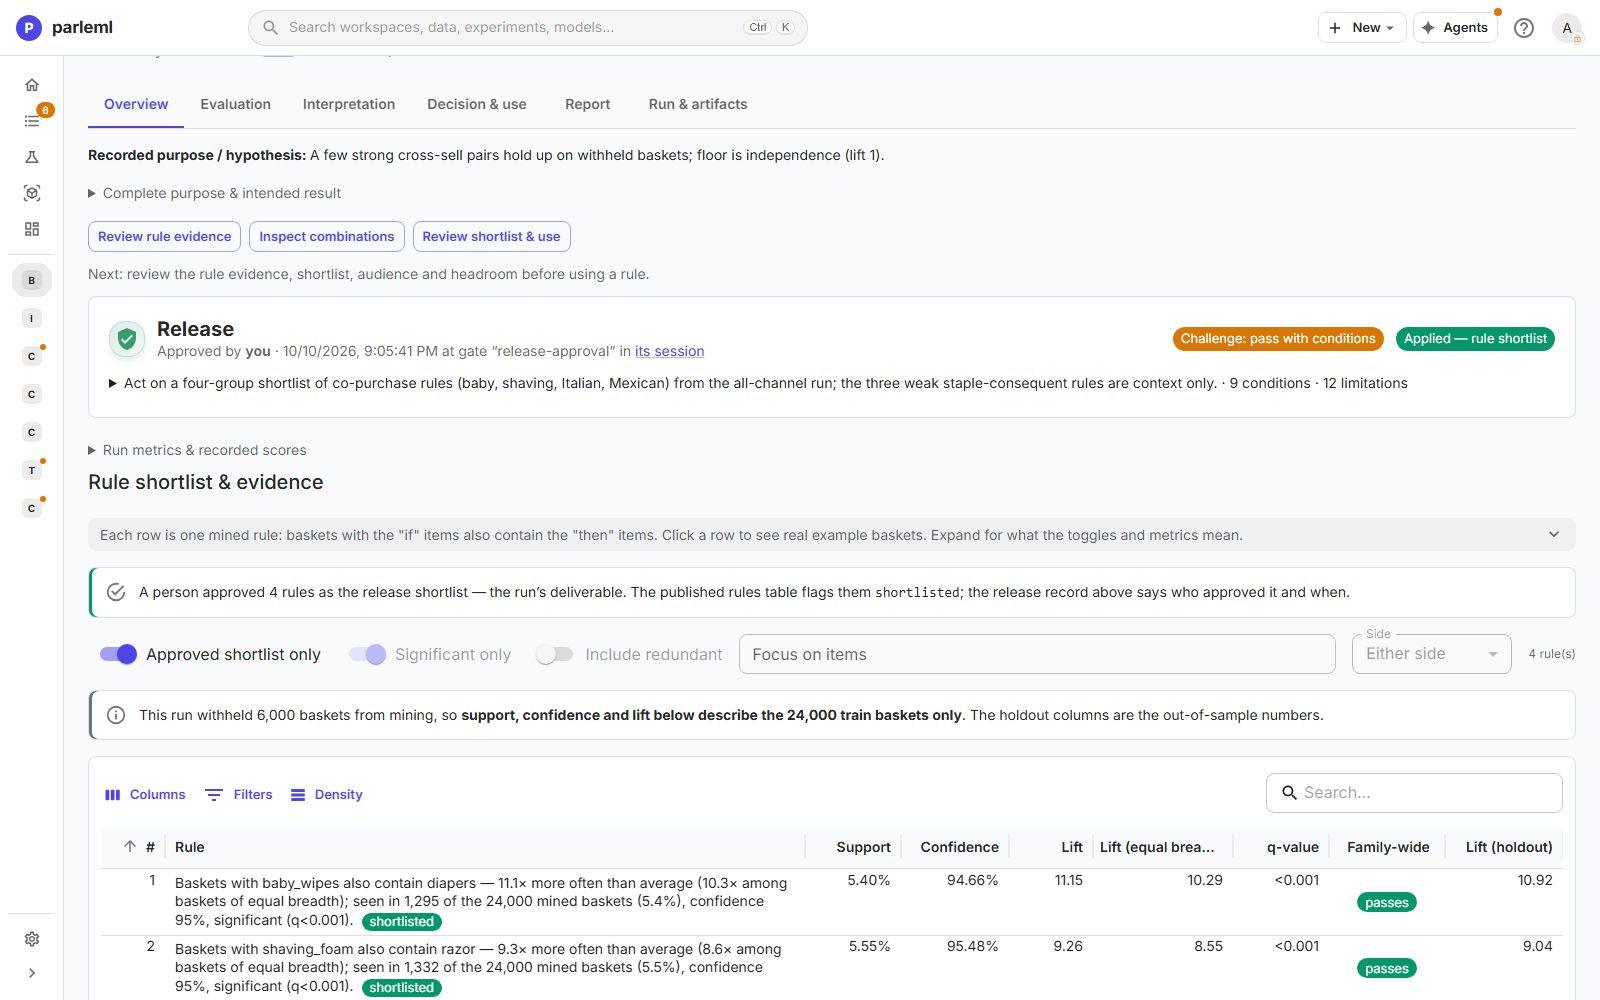
Decision & use holds the release. Here a person approved a four-rule shortlist (baby wipes → diapers, shaving foam → razor, parmesan → tomato sauce, salsa + tortilla chips → guacamole), with 9 conditions and 12 limitations. The shortlist is flagged on the run and on its published rules table.
What carries over
Whatever the kind:
- Run & artifacts has the downloads, the recorded run settings, the pipeline stages with timings, the console and the notifications.
- Report holds the AutoDoc model card once it has been generated.
- Publish results writes a report to the workspace's Documents.
- A run can be registered as a model, where the kind produces one, and released through the same release record.
- Experiments of the same kind can be compared side by side.
Next
- Compare: line up two runs of the same kind.
- Models and release: register and release what you built.